Sallie Mae 2006 Annual Report Download - page 176
Download and view the complete annual report
Please find page 176 of the 2006 Sallie Mae annual report below. You can navigate through the pages in the report by either clicking on the pages listed below, or by using the keyword search tool below to find specific information within the annual report.-
 1
1 -
2
-
3
-
4
-
5
-
6
-
7
-
8
-
9
-
10
-
11
-
12
-
13
-
14
-
15
-
16
-
17
-
18
-
19
-
20
-
21
-
22
-
23
-
24
-
25
-
26
-
27
-
28
-
29
-
30
-
31
-
32
-
33
-
34
-
35
-
36
-
37
-
38
-
39
-
40
-
41
-
42
-
43
-
44
-
45
-
46
-
47
-
48
-
49
-
50
-
51
-
52
-
53
-
54
-
55
-
56
-
57
-
58
-
59
-
60
-
61
-
62
-
63
-
64
-
65
-
66
-
67
-
68
-
69
-
70
-
71
-
72
-
73
-
74
-
75
-
76
-
77
-
78
-
79
-
80
-
81
-
82
-
83
-
84
-
85
-
86
-
87
-
88
-
89
-
90
-
91
-
92
-
93
-
94
-
95
-
96
-
97
-
98
-
99
-
100
-
101
-
102
-
103
-
104
-
105
-
106
-
107
-
108
-
109
-
110
-
111
-
112
-
113
-
114
-
115
-
116
-
117
-
118
-
119
-
120
-
121
-
122
-
123
-
124
-
125
-
126
-
127
-
128
-
129
-
130
-
131
-
132
-
133
-
134
-
135
-
136
-
137
-
138
-
139
-
140
-
141
-
142
-
143
-
144
-
145
-
146
-
147
-
148
-
149
-
150
-
151
-
152
-
153
-
154
-
155
-
156
-
157
-
158
-
159
-
160
-
161
-
162
-
163
-
164
-
165
-
 166
166 -
 167
167 -
 168
168 -
 169
169 -
 170
170 -
 171
171 -
 172
172 -
 173
173 -
 174
174 -
 175
175 -
 176
176 -
 177
177 -
 178
178 -
 179
179 -
 180
180 -
 181
181 -
 182
182 -
 183
183 -
 184
184 -
 185
185 -
 186
186 -
187
-
188
-
189
-
190
-
191
-
192
-
193
-
194
-
195
-
196
-
197
-
198
-
199
-
200
-
201
-
202
-
203
-
204
-
205
-
206
-
207
-
208
-
209
-
210
-
211
-
212
-
213
-
214
-
215
 |
 |

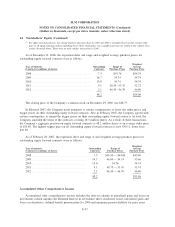
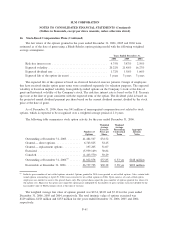
14. Stockholders’ Equity (Continued)
(2)
For equity forward contracts, the average purchase price per share for 2005 and 2004 is calculated based on the average strike
price of all equity forward contracts including those whose strike prices were amended and were net settled in the cashless trans-
actions discussed above. There were no such cashless transactions in 2006.
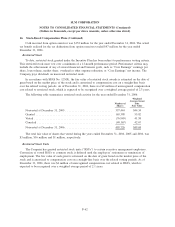
As of December 31, 2006, the expiration dates and range and weighted average purchase prices for
outstanding equity forward contracts were as follows:
Year of Maturity
(Contracts in millions of shares)
Outstanding
Contracts
Range of
Purchase Prices
Weighted
Average
Purchase Price
2008 ..................................... 7.3 $54.74 $54.74
2009 ..................................... 14.7 54.74 54.74
2010 ..................................... 15.0 54.74 54.74
2011 ..................................... 9.1 50.30 - 53.76 52.72
2012 ..................................... 2.1 46.30 - 46.70 46.40
48.2 $54.00
The closing price of the Company’s common stock on December 29, 2006 was $48.77.
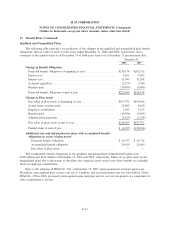
In February 2007, the Company made payments to certain counterparties to lower the strike prices and
trigger prices on their outstanding equity forward contracts. Also in February 2007, the Company agreed with
certain counterparties to amend the trigger prices on their outstanding equity forward contracts. In total, the
Company amended the terms of the contracts covering 18.5 million shares. As a result of these transactions,
the Company’s aggregate position on equity forward contracts is 48.2 million shares at an average strike price
of $51.86. The highest trigger price on all outstanding equity forward contracts is now $30.11, down from
$35.58.
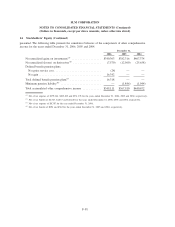
As of February 28, 2007, the expiration dates and range of and weighted average purchase prices for
outstanding equity forward contracts were as follows:
Year of maturity
(Contracts in millions of shares)
Outstanding
Contracts
Range of
Purchase Prices
Weighted
Average
Purchase Price
2008 ................................... 7.3 $43.50 — $44.00 $43.80
2009 ................................... 14.7 46.00 — 54.74 53.66
2010 ................................... 15.0 54.74 54.74
2011 ................................... 9.1 49.75 — 53.76 51.91
2012 ................................... 2.1 46.30 — 46.70 46.40
48.2 $51.86
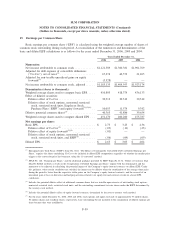
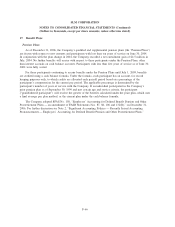
Accumulated Other Comprehensive Income
Accumulated other comprehensive income includes the after-tax change in unrealized gains and losses on
investments (which includes the Retained Interest in off-balance sheet securitized loans), unrealized gains and
losses on derivatives, defined benefit pension plans for 2006 and minimum pension liability for prior years
F-57
SLM CORPORATION
NOTES TO CONSOLIDATED FINANCIAL STATEMENTS (Continued)
(Dollars in thousands, except per share amounts, unless otherwise stated)