Sallie Mae 2006 Annual Report Download - page 186
Download and view the complete annual report
Please find page 186 of the 2006 Sallie Mae annual report below. You can navigate through the pages in the report by either clicking on the pages listed below, or by using the keyword search tool below to find specific information within the annual report.-
 1
1 -
2
-
3
-
4
-
5
-
6
-
7
-
8
-
9
-
10
-
11
-
12
-
13
-
14
-
15
-
16
-
17
-
18
-
19
-
20
-
21
-
22
-
23
-
24
-
25
-
26
-
27
-
28
-
29
-
30
-
31
-
32
-
33
-
34
-
35
-
36
-
37
-
38
-
39
-
40
-
41
-
42
-
43
-
44
-
45
-
46
-
47
-
48
-
49
-
50
-
51
-
52
-
53
-
54
-
55
-
56
-
57
-
58
-
59
-
60
-
61
-
62
-
63
-
64
-
65
-
66
-
67
-
68
-
69
-
70
-
71
-
72
-
73
-
74
-
75
-
76
-
77
-
78
-
79
-
80
-
81
-
82
-
83
-
84
-
85
-
86
-
87
-
88
-
89
-
90
-
91
-
92
-
93
-
94
-
95
-
96
-
97
-
98
-
99
-
100
-
101
-
102
-
103
-
104
-
105
-
106
-
107
-
108
-
109
-
110
-
111
-
112
-
113
-
114
-
115
-
116
-
117
-
118
-
119
-
120
-
121
-
122
-
123
-
124
-
125
-
126
-
127
-
128
-
129
-
130
-
131
-
132
-
133
-
134
-
135
-
136
-
137
-
138
-
139
-
140
-
141
-
142
-
143
-
144
-
145
-
146
-
147
-
148
-
149
-
150
-
151
-
152
-
153
-
154
-
155
-
156
-
157
-
158
-
159
-
160
-
161
-
162
-
163
-
164
-
165
-
166
-
167
-
168
-
169
-
170
-
171
-
172
-
173
-
174
-
175
-
 176
176 -
 177
177 -
 178
178 -
 179
179 -
 180
180 -
 181
181 -
 182
182 -
 183
183 -
 184
184 -
 185
185 -
 186
186 -
 187
187 -
 188
188 -
 189
189 -
 190
190 -
 191
191 -
 192
192 -
 193
193 -
 194
194 -
 195
195 -
 196
196 -
197
-
198
-
199
-
200
-
201
-
202
-
203
-
204
-
205
-
206
-
207
-
208
-
209
-
210
-
211
-
212
-
213
-
214
-
215
 |
 |

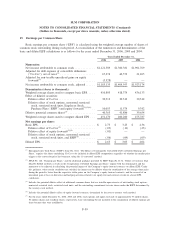
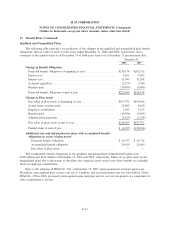
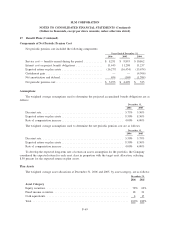
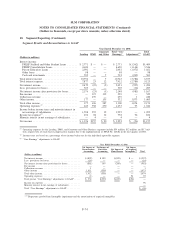
Qualified and Nonqualified Plans
The following tables provide a reconciliation of the changes in the qualified and nonqualified plan benefit
obligations and fair value of assets for the years ended December 31, 2006 and 2005, respectively, and a
statement of the funded status as of December 31 of both years based on a December 31 measurement date.
2006 2005
December 31,
Change in Benefit Obligation
Projected benefit obligation at beginning of year.................... $216,138 $202,352
Service cost............................................... 8,291 9,893
Interest cost............................................... 11,445 11,208
Actuarial (gain)/loss......................................... (2,274) 2,380
Benefits paid .............................................. (10,994) (9,695)
Projected benefit obligation at end of year ........................ $222,606 $216,138
Change in Plan Assets
Fair value of plan assets at beginning of year ...................... $197,972 $199,816
Actual return on plan assets ................................... 31,805 8,160
Employer contribution ....................................... 1,015 1,225
Benefits paid .............................................. (10,994) (9,695)
Administrative payments ..................................... (1,429) (1,534)
Fair value of plan assets at end of year . . . ........................ $218,369 $197,972
Funded status at end of year................................... $ (4,237) $ (18,166)
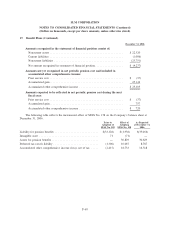
Additional year-end information for plans with accumulated benefit
obligations in excess of plan assets:
Projected benefit obligation ................................. $ 26,757 $ 25,716
Accumulated benefit obligation .............................. 24,819 21,869
Fair value of plan assets .................................... — —
The accumulated benefit obligations of the qualified and nonqualified defined benefit plans were
$218 million and $211 million at December 31, 2006 and 2005, respectively. There are no plan assets in the
nonqualified plans due to the nature of the plans; the corporate assets used to pay these benefits are included
above in employer contributions.
Prior to the adoption of SFAS No. 158, at December 31, 2005, unrecognized net actuarial gains were
$8 million, unrecognized prior service cost was $.1 million, and accrued pension cost was $26 million. Under
SFAS No. 158 in 2006, previously unrecognized gains and prior service cost are recognized as a component of
other comprehensive income.
F-67
SLM CORPORATION
NOTES TO CONSOLIDATED FINANCIAL STATEMENTS (Continued)
(Dollars in thousands, except per share amounts, unless otherwise stated)
17. Benefit Plans (Continued)