Sallie Mae 2006 Annual Report Download - page 66
Download and view the complete annual report
Please find page 66 of the 2006 Sallie Mae annual report below. You can navigate through the pages in the report by either clicking on the pages listed below, or by using the keyword search tool below to find specific information within the annual report.-
 1
1 -
2
-
3
-
4
-
5
-
6
-
7
-
8
-
9
-
10
-
11
-
12
-
13
-
14
-
15
-
16
-
17
-
18
-
19
-
20
-
21
-
22
-
23
-
24
-
25
-
26
-
27
-
28
-
29
-
30
-
31
-
32
-
33
-
34
-
35
-
36
-
37
-
38
-
39
-
40
-
41
-
42
-
43
-
44
-
45
-
46
-
47
-
48
-
49
-
50
-
51
-
52
-
53
-
54
-
55
-
 56
56 -
 57
57 -
 58
58 -
 59
59 -
 60
60 -
 61
61 -
 62
62 -
 63
63 -
 64
64 -
 65
65 -
 66
66 -
 67
67 -
 68
68 -
 69
69 -
 70
70 -
 71
71 -
 72
72 -
 73
73 -
 74
74 -
 75
75 -
 76
76 -
77
-
78
-
79
-
80
-
81
-
82
-
83
-
84
-
85
-
86
-
87
-
88
-
89
-
90
-
91
-
92
-
93
-
94
-
95
-
96
-
97
-
98
-
99
-
100
-
101
-
102
-
103
-
104
-
105
-
106
-
107
-
108
-
109
-
110
-
111
-
112
-
113
-
114
-
115
-
116
-
117
-
118
-
119
-
120
-
121
-
122
-
123
-
124
-
125
-
126
-
127
-
128
-
129
-
130
-
131
-
132
-
133
-
134
-
135
-
136
-
137
-
138
-
139
-
140
-
141
-
142
-
143
-
144
-
145
-
146
-
147
-
148
-
149
-
150
-
151
-
152
-
153
-
154
-
155
-
156
-
157
-
158
-
159
-
160
-
161
-
162
-
163
-
164
-
165
-
166
-
167
-
168
-
169
-
170
-
171
-
172
-
173
-
174
-
175
-
176
-
177
-
178
-
179
-
180
-
181
-
182
-
183
-
184
-
185
-
186
-
187
-
188
-
189
-
190
-
191
-
192
-
193
-
194
-
195
-
196
-
197
-
198
-
199
-
200
-
201
-
202
-
203
-
204
-
205
-
206
-
207
-
208
-
209
-
210
-
211
-
212
-
213
-
214
-
215
 |
 |

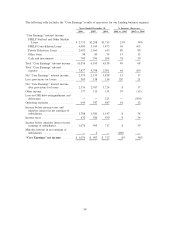
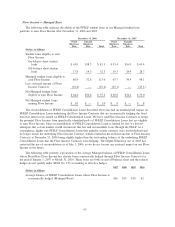
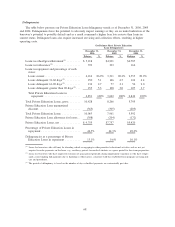
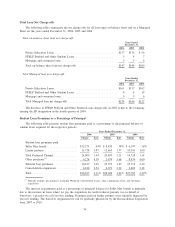
Floor Income — Managed Basis
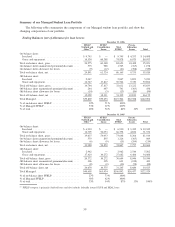
The following table analyzes the ability of the FFELP student loans in our Managed student loan
portfolio to earn Floor Income after December 31, 2006 and 2005
Fixed
Borrower
Rate
Variable
Borrower
Rate Total
Fixed
Borrower
Rate
Variable
Borrower
Rate Total
December 31, 2006 December 31, 2005
(Dollars in billions)
Student loans eligible to earn
Floor Income:
On-balance sheet student
loans ................... $63.0 $18.3 $ 81.3 $ 53.4 $16.0 $ 69.4
Off-balance sheet student
loans ................... 17.8 14.5 32.3 10.3 18.4 28.7
Managed student loans eligible to
earn Floor Income ........... 80.8 32.8 113.6 63.7 34.4 98.1
Less: notional amount of Floor
Income Contracts ........... (16.4) — (16.4) (25.1) — (25.1)
Net Managed student loans
eligible to earn Floor Income. . . $ 64.4 $32.8 $ 97.2 $ 38.6 $34.4 $ 73.0
Net Managed student loans
earning Floor Income ........ $ 1.0 $ — $ 1.0 $ .8 $ — $ .8
The reconsolidation of FFELP Consolidation Loans described above has had an unanticipated impact on
FFELP Consolidation Loans underlying the Floor Income Contracts that are economically hedging the fixed
borrower interest rate earned on FFELP Consolidation Loans. We have sold Floor Income Contracts to hedge
the potential Floor Income from specifically identified pools of FFELP Consolidation Loans that are eligible
to earn Floor Income. Since reconsolidation of FFELP Consolidation Loans is limited by law, we did not
anticipate that certain lenders would circumvent this law and reconsolidate loans through the FDLP. As a
consequence, higher rate FFELP Consolidation Loans that underlie certain contracts were reconsolidated and
no longer match the underlying Floor Income Contract, which resulted in the notional amount of Floor Income
Contracts at December 31, 2006 being slightly higher than the outstanding balance of the underlying FFELP
Consolidation Loans that the Floor Income Contracts were hedging. The Higher Education Act of 2005 has
restricted the use of reconsolidation as of July 1, 2006, so we do not foresee any material impact on our Floor
Income in the future.
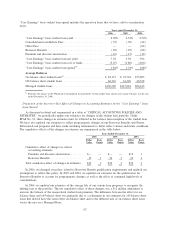
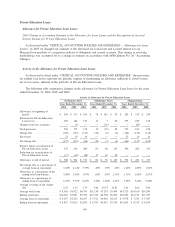
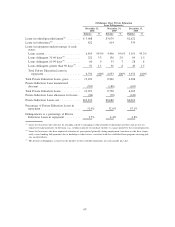
The following table presents a projection of the average Managed balance of FFELP Consolidation Loans
whose Fixed Rate Floor Income has already been economically hedged through Floor Income Contracts for
the period January 1, 2007 to March 31, 2010. These loans are both on and off-balance sheet and the related
hedges do not qualify under SFAS No. 133 accounting as effective hedges.
2007 2008 2009 2010
(Dollars in billions)
Average balance of FFELP Consolidation Loans whose Floor Income is
economically hedged (Managed Basis) ....................... $16 $15 $10 $2
65