Sallie Mae 2006 Annual Report Download - page 47
Download and view the complete annual report
Please find page 47 of the 2006 Sallie Mae annual report below. You can navigate through the pages in the report by either clicking on the pages listed below, or by using the keyword search tool below to find specific information within the annual report.-
 1
1 -
2
-
3
-
4
-
5
-
6
-
7
-
8
-
9
-
10
-
11
-
12
-
13
-
14
-
15
-
16
-
17
-
18
-
19
-
20
-
21
-
22
-
23
-
24
-
25
-
26
-
27
-
28
-
29
-
30
-
31
-
32
-
33
-
34
-
35
-
36
-
 37
37 -
 38
38 -
 39
39 -
 40
40 -
 41
41 -
 42
42 -
 43
43 -
 44
44 -
 45
45 -
 46
46 -
 47
47 -
 48
48 -
 49
49 -
 50
50 -
 51
51 -
 52
52 -
 53
53 -
 54
54 -
 55
55 -
 56
56 -
 57
57 -
58
-
59
-
60
-
61
-
62
-
63
-
64
-
65
-
66
-
67
-
68
-
69
-
70
-
71
-
72
-
73
-
74
-
75
-
76
-
77
-
78
-
79
-
80
-
81
-
82
-
83
-
84
-
85
-
86
-
87
-
88
-
89
-
90
-
91
-
92
-
93
-
94
-
95
-
96
-
97
-
98
-
99
-
100
-
101
-
102
-
103
-
104
-
105
-
106
-
107
-
108
-
109
-
110
-
111
-
112
-
113
-
114
-
115
-
116
-
117
-
118
-
119
-
120
-
121
-
122
-
123
-
124
-
125
-
126
-
127
-
128
-
129
-
130
-
131
-
132
-
133
-
134
-
135
-
136
-
137
-
138
-
139
-
140
-
141
-
142
-
143
-
144
-
145
-
146
-
147
-
148
-
149
-
150
-
151
-
152
-
153
-
154
-
155
-
156
-
157
-
158
-
159
-
160
-
161
-
162
-
163
-
164
-
165
-
166
-
167
-
168
-
169
-
170
-
171
-
172
-
173
-
174
-
175
-
176
-
177
-
178
-
179
-
180
-
181
-
182
-
183
-
184
-
185
-
186
-
187
-
188
-
189
-
190
-
191
-
192
-
193
-
194
-
195
-
196
-
197
-
198
-
199
-
200
-
201
-
202
-
203
-
204
-
205
-
206
-
207
-
208
-
209
-
210
-
211
-
212
-
213
-
214
-
215
 |
 |
borrowers were permitted for the first time to consolidate their loans while still in school. Second, a significant
volume of our FFELP Consolidation Loans was reconsolidated with third party lenders through the FDLP,
resulting in an increase in student loan premium write-offs. In addition, the repeal of the Single Holder Rule
also increased the amount of loans that consolidated with third parties. Consolidation of student loans does
benefit the student loan spread to a lesser extent through the write-off of Borrower Benefits reserves associated
with these loans. Both in-school consolidation and reconsolidation with third party lenders through the FDLP
were restricted as of July 1, 2006 through the Higher Education Act of 2005. While FFELP Consolidation
Loan activity remained high in 2006, it was lower than 2005, which contributed to lower student loan premium
amortization in 2006.
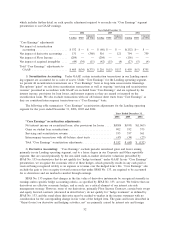
Discussion of Student Loan Spread — Other Year-over-Year Fluctuations — 2006 versus 2005
The decrease in the 2006 student loan spread versus 2005 is primarily due to the decrease in gross Floor
Income discussed above. Additionally, a higher average balance of FFELP Consolidation Loans as a
percentage of the on-balance sheet portfolio contributes to downward pressure on the spread. FFELP
Consolidation Loans have lower spreads than other FFELP loans due to the 105 basis point Consolidation
Loan Rebate Fee, higher Borrower Benefits, and funding costs due to their longer terms. These negative
effects are partially offset by lower student loan premium amortization due to the extended term and a higher
Special Allowance Payment (“SAP”) yield. The average balance of FFELP Consolidation Loans grew as a
percentage of the average on-balance sheet FFELP student loan portfolio from 69 percent in 2005 to 72 percent
in 2006.
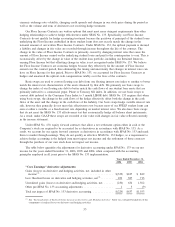
Discussion of Student Loan Spread — Other Year-over-Year Fluctuations — 2005 versus 2004
The decrease in the 2005 student loan spread versus 2004 is primarily due to the decrease in gross Floor
Income discussed above. Additionally, higher average balance of FFELP Consolidation Loans as a percentage
of the on-balance sheet portfolio contributes to downward pressure on the spread. The average balance of
FFELP Consolidation Loans grew as a percentage of the average on-balance sheet FFELP student loan
portfolio from 62 percent in 2004 to 69 percent in 2005.
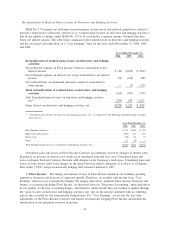
Other factors that impacted the student loan spread include higher spreads on our debt funding student
loans as a result of the GSE Wind-Down, partially offset by lower Borrower Benefits costs, and the absence of
Offset Fees on GSE financed loans. The increase in funding costs is due to the replacement of lower cost,
primarily short-term GSE funding with longer term, higher cost funding. The negative effects on the spread
were partially offset by the 43 percent increase in Private Education Loans in the on-balance sheet student
loan portfolio.
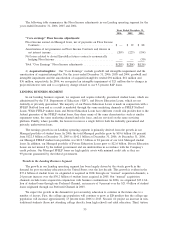
Wholesale Consolidation Loans
As discussed above, the on-balance sheet student loan spread excludes the impact of our Wholesale
Consolidation Loan portfolio whose average balance was $683 million for the year ended December 31, 2006.
Had the impact of the Wholesale Consolidation Loan volume been included in the on-balance sheet student
loan spread it would have reduced the spread by approximately 1 basis point for the year ended December 31,
2006. As of December 31, 2006, Wholesale Consolidation Loans totaled $3.6 billion, or 5.9 percent, of our
total on-balance sheet FFELP Consolidation Loan portfolio.
46