Sallie Mae 2006 Annual Report Download - page 40
Download and view the complete annual report
Please find page 40 of the 2006 Sallie Mae annual report below. You can navigate through the pages in the report by either clicking on the pages listed below, or by using the keyword search tool below to find specific information within the annual report.-
 1
1 -
2
-
3
-
4
-
5
-
6
-
7
-
8
-
9
-
10
-
11
-
12
-
13
-
14
-
15
-
16
-
17
-
18
-
19
-
20
-
21
-
22
-
23
-
24
-
25
-
26
-
27
-
28
-
29
-
 30
30 -
 31
31 -
 32
32 -
 33
33 -
 34
34 -
 35
35 -
 36
36 -
 37
37 -
 38
38 -
 39
39 -
 40
40 -
 41
41 -
 42
42 -
 43
43 -
 44
44 -
 45
45 -
 46
46 -
 47
47 -
 48
48 -
 49
49 -
 50
50 -
51
-
52
-
53
-
54
-
55
-
56
-
57
-
58
-
59
-
60
-
61
-
62
-
63
-
64
-
65
-
66
-
67
-
68
-
69
-
70
-
71
-
72
-
73
-
74
-
75
-
76
-
77
-
78
-
79
-
80
-
81
-
82
-
83
-
84
-
85
-
86
-
87
-
88
-
89
-
90
-
91
-
92
-
93
-
94
-
95
-
96
-
97
-
98
-
99
-
100
-
101
-
102
-
103
-
104
-
105
-
106
-
107
-
108
-
109
-
110
-
111
-
112
-
113
-
114
-
115
-
116
-
117
-
118
-
119
-
120
-
121
-
122
-
123
-
124
-
125
-
126
-
127
-
128
-
129
-
130
-
131
-
132
-
133
-
134
-
135
-
136
-
137
-
138
-
139
-
140
-
141
-
142
-
143
-
144
-
145
-
146
-
147
-
148
-
149
-
150
-
151
-
152
-
153
-
154
-
155
-
156
-
157
-
158
-
159
-
160
-
161
-
162
-
163
-
164
-
165
-
166
-
167
-
168
-
169
-
170
-
171
-
172
-
173
-
174
-
175
-
176
-
177
-
178
-
179
-
180
-
181
-
182
-
183
-
184
-
185
-
186
-
187
-
188
-
189
-
190
-
191
-
192
-
193
-
194
-
195
-
196
-
197
-
198
-
199
-
200
-
201
-
202
-
203
-
204
-
205
-
206
-
207
-
208
-
209
-
210
-
211
-
212
-
213
-
214
-
215
 |
 |

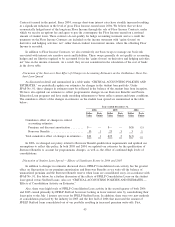
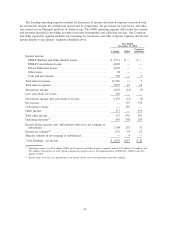
Condensed Balance Sheets
2006 2005 $ % $ %
December 31, 2006 vs. 2005 2005 vs. 2004
Increase (Decrease)
Assets
FFELP Stafford and Other Student Loans, net .... $ 24,841 $19,988 $ 4,853 24% $ 1,023 5%
FFELP Consolidation Loans, net .............. 61,324 54,859 6,465 12 13,263 32
Private Education Loans, net ................. 9,755 7,757 1,998 26 2,337 43
Other loans, net ........................... 1,309 1,138 171 15 90 9
Cash and investments....................... 5,185 4,868 317 7 (2,107) (30)
Restricted cash and investments ............... 3,423 3,300 123 4 1,089 49
Retained Interest in off-balance sheet securitized
loans . ................................ 3,341 2,406 935 39 90 4
Goodwill and acquired intangible assets, net ...... 1,372 1,105 267 24 39 4
Other assets .............................. 5,586 3,918 1,668 43 (579) (13)
Total assets .............................. $116,136 $99,339 $16,797 17% $15,245 18%
Liabilities and Stockholders’ Equity
Short-term borrowings ...................... $ 3,528 $ 3,810 $ (282) (7)% $ 1,603 73%
Long-term borrowings ...................... 104,559 88,119 16,440 19 12,204 16
Other liabilities ........................... 3,680 3,609 71 2 811 29
Total liabilities ........................... 111,767 95,538 16,229 17 14,618 18
Minority interest in subsidiaries ............... 9 9 — — (63) (88)
Stockholders’ equity before treasury stock ....... 5,401 4,364 1,037 24 (765) (15)
Common stock held in treasury ............... 1,041 572 469 82 (1,455) (72)
Total stockholders’ equity ................... 4,360 3,792 568 15 690 22
Total liabilities and stockholders’ equity ......... $116,136 $99,339 $16,797 17% $15,245 18%
RESULTS OF OPERATIONS
We present the results of operations first on a consolidated basis followed by a presentation of the net
interest margin with accompanying analysis presented in accordance with GAAP. As discussed in detail above
in the “OVERVIEW” section, we have two primary business segments, Lending and DMO, plus a Corporate
and Other business segment. Since these business segments operate in distinct business environments, the
discussion following the results of our operations is primarily presented on a segment basis. See “BUSINESS
SEGMENTS” for further discussion on the components of each segment. Securitization gains and the ongoing
servicing and securitization income are included in “LIQUIDITY AND CAPITAL RESOURCES — Securitiza-
tion Activities.” The discussion of derivative market value gains and losses is under “BUSINESS
SEGMENTS — Limitations of ‘Core Earnings’ — Pre-tax Differences between ‘Core Earnings’ and GAAP by
Business Segment — Derivative Accounting”.
CONSOLIDATED EARNINGS SUMMARY
The main drivers of our net income are the growth in our Managed student loan portfolio, which drives
net interest income and securitization transactions, market value gains and losses on derivatives that do not
receive hedge accounting treatment, the timing and size of securitization gains, growth in our fee-based
business and expense control.
39