Sallie Mae 2006 Annual Report Download - page 200
Download and view the complete annual report
Please find page 200 of the 2006 Sallie Mae annual report below. You can navigate through the pages in the report by either clicking on the pages listed below, or by using the keyword search tool below to find specific information within the annual report.-
 1
1 -
2
-
3
-
4
-
5
-
6
-
7
-
8
-
9
-
10
-
11
-
12
-
13
-
14
-
15
-
16
-
17
-
18
-
19
-
20
-
21
-
22
-
23
-
24
-
25
-
26
-
27
-
28
-
29
-
30
-
31
-
32
-
33
-
34
-
35
-
36
-
37
-
38
-
39
-
40
-
41
-
42
-
43
-
44
-
45
-
46
-
47
-
48
-
49
-
50
-
51
-
52
-
53
-
54
-
55
-
56
-
57
-
58
-
59
-
60
-
61
-
62
-
63
-
64
-
65
-
66
-
67
-
68
-
69
-
70
-
71
-
72
-
73
-
74
-
75
-
76
-
77
-
78
-
79
-
80
-
81
-
82
-
83
-
84
-
85
-
86
-
87
-
88
-
89
-
90
-
91
-
92
-
93
-
94
-
95
-
96
-
97
-
98
-
99
-
100
-
101
-
102
-
103
-
104
-
105
-
106
-
107
-
108
-
109
-
110
-
111
-
112
-
113
-
114
-
115
-
116
-
117
-
118
-
119
-
120
-
121
-
122
-
123
-
124
-
125
-
126
-
127
-
128
-
129
-
130
-
131
-
132
-
133
-
134
-
135
-
136
-
137
-
138
-
139
-
140
-
141
-
142
-
143
-
144
-
145
-
146
-
147
-
148
-
149
-
150
-
151
-
152
-
153
-
154
-
155
-
156
-
157
-
158
-
159
-
160
-
161
-
162
-
163
-
164
-
165
-
166
-
167
-
168
-
169
-
170
-
171
-
172
-
173
-
174
-
175
-
176
-
177
-
178
-
179
-
180
-
181
-
182
-
183
-
184
-
185
-
186
-
187
-
188
-
189
-
 190
190 -
 191
191 -
 192
192 -
 193
193 -
 194
194 -
 195
195 -
 196
196 -
 197
197 -
 198
198 -
 199
199 -
 200
200 -
 201
201 -
 202
202 -
 203
203 -
 204
204 -
 205
205 -
 206
206 -
 207
207 -
 208
208 -
 209
209 -
 210
210 -
211
-
212
-
213
-
214
-
215
 |
 |

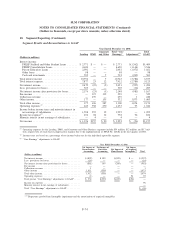
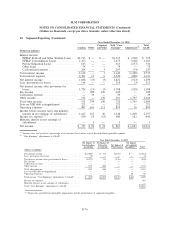
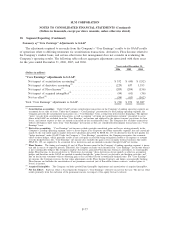
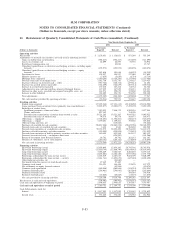
21. Restatement of Quarterly Consolidated Statements of Cash Flows (unaudited)
The following tables set forth the effects of the restatement of the quarterly consolidated statements of
cash flows for the quarters in 2006 and 2005. See also Note 2, “Significant Accounting Policies — Statement
of Cash Flows — Restatement of the Consolidated Statements of Cash Flows.”
(Dollars in thousands)
As Previously
Reported Restated
As Previously
Reported Restated
2006 2005
Three Months Ended March 31,
Operating activities
Net income ................................................. $ 151,601 $ 151,601 $ 223,384 $ 223,384
Adjustments to reconcile net income to net cash used in operating activities:
Gains on student loan securitizations . . .............................. (30,023) (30,023) (49,894) (49,894)
Losses on securities, net . ....................................... — 2,948 — 2,199
Stock-based compensation cost . . .................................. — 22,768 — 5,036
Unrealized (gains)/losses on derivative and hedging activities, excluding equity
forwards ................................................ (83,332) (83,332) (196,516) (196,516)
Unrealized (gains)/losses on derivative and hedging activities — equity forwards ...... 122,411 122,411 108,307 108,307
Provisions for losses . . . ....................................... 60,319 60,319 46,523 46,523
Minority interest, net . . . ....................................... (1,674) (1,674) (2,284) (2,284)
Mortgage loans originated ....................................... (349,332) (349,332) (368,737) (368,737)
Proceeds from sales of mortgage loans . .............................. 368,008 368,008 280,793 280,793
(Increase) decrease in restricted cash-other . . ........................... 22,120 (63,629) (103,246) 19,567
(Increase) in accrued interest receivable . .............................. (233,427) (233,427) (110,922) (110,922)
Increase in accrued interest payable . . . .............................. 30,253 30,253 7,195 7,195
Decrease in Retained Interest in off-balance sheet securitized loans, net . .......... 52,524 52,524 9,165 9,165
(Increase) decrease in other assets, goodwill and acquired intangible assets, net . ...... (95,061) (66,988) 53,637 76,828
(Decrease) in other liabilities . . . .................................. (214,854) (193,826) (29,932) (29,932)
Total adjustments ............................................ (352,068) (363,000) (355,911) (202,672)
Net cash (used in) provided by operating activities ........................ (200,467) (211,399) (132,527) 20,712
Investing activities
Student loans acquired . . ....................................... (8,336,703) (8,322,746) (7,396,513) (7,385,964)
Loans purchased from securitized trusts (primarily loan consolidations) . . .......... (1,338,498) (1,338,498) (1,831,300) (1,831,300)
Reduction of student loans:
Installment payments, claims and other. . . ........................... 2,213,562 2,494,862 1,419,656 1,702,842
Claims and resales . . . ....................................... 281,300 — 283,186 —
Proceeds from securitization of student loans treated as sales . ............... 7,985,275 7,985,275 3,544,305 3,544,305
Proceeds from sales of student loans . .............................. 9,214 9,214 14,709 14,709
Other loans-originated . . ....................................... (289,585) (289,585) (116,791) (116,791)
Other loans-repaid ........................................... 295,396 295,396 156,589 156,589
Other investing activities, net . . . .................................. — (33,065) — (40,306)
Purchases of available-for-sale securities .............................. (10,290,599) (10,263,898) (28,684,462) (28,655,855)
Proceeds from sales of available-for-sale securities ........................ — — 841,797 482,944
Proceeds from maturities of available-for-sale securities . .................... 10,810,275 10,811,460 28,955,447 29,314,300
Purchases of held-to-maturity and other securities ......................... (235,804) (235,804) (150,388) (150,388)
Proceeds from maturities of held-to-maturity securities and other securities . . . ...... 191,556 176,344 155,973 155,973
Decrease (increase) in restricted cash — on-balance sheet trusts . ............... — 100,961 — (122,813)
Return of investment from Retained Interest . . . ......................... 36,580 36,580 73,196 73,196
Net cash provided by (used in) investing activities ........................ 1,331,969 1,426,496 (2,734,596) (2,858,559)
Financing activities
Short-term borrowings issued . . . .................................. 15,294,416 15,290,752 4,568,130 4,568,130
Short-term borrowings repaid . . . .................................. (15,297,685) (15,297,685) (2,921,784) (2,921,784)
Long-term borrowings issued . . . .................................. 1,658,926 1,653,839 1,664,501 1,660,336
Long-term borrowings repaid . . . .................................. (1,800,449) (1,763,784) (2,559,972) (100,103)
Borrowings collateralized by loans in trust issued ......................... — — — —
Borrowings collateralized by loans in trust — activity . ..................... (1,042,156) (1,082,549) (337,420) (2,800,577)
Other financing activities, net . . . .................................. — (22,681) — —
Tax benefit from the exercise of stock-based awards . . . .................... 17,108 17,108 — —
Common stock issued . . ....................................... 106,522 71,942 56,244 46,969
Net settlements on equity forward contracts . . . ......................... — (13,855) — (12,548)
Common stock repurchased ...................................... (181,846) (181,846) (179,386) (179,386)
Common dividends paid . ....................................... (91,473) (91,473) (79,933) (79,933)
Preferred dividends paid . ....................................... (8,142) (8,142) (2,875) (2,875)
Net cash (used in) provided by financing activities ........................ (1,344,779) (1,428,374) 207,505 178,229
Net decrease in cash and cash equivalents . .............................. (213,277) (213,277) (2,659,618) (2,659,618)
Cash and cash equivalents at beginning of period . ......................... 2,498,655 2,498,655 3,395,487 3,395,487
Cash and cash equivalents at end of period ............................ $ 2,285,378 $ 2,285,378 $ 735,869 $ 735,869
Cash disbursements made for:
Interest . ................................................. $ 1,022,758 $ 1,022,758 $ 437,243 $ 437,243
Income taxes . . . ............................................ $ 148,597 $ 148,597 $ 12,384 $ 12,384
F-81
SLM CORPORATION
NOTES TO CONSOLIDATED FINANCIAL STATEMENTS (Continued)
(Dollars in thousands, except per share amounts, unless otherwise stated)