Sallie Mae 2006 Annual Report Download - page 74
Download and view the complete annual report
Please find page 74 of the 2006 Sallie Mae annual report below. You can navigate through the pages in the report by either clicking on the pages listed below, or by using the keyword search tool below to find specific information within the annual report.-
 1
1 -
2
-
3
-
4
-
5
-
6
-
7
-
8
-
9
-
10
-
11
-
12
-
13
-
14
-
15
-
16
-
17
-
18
-
19
-
20
-
21
-
22
-
23
-
24
-
25
-
26
-
27
-
28
-
29
-
30
-
31
-
32
-
33
-
34
-
35
-
36
-
37
-
38
-
39
-
40
-
41
-
42
-
43
-
44
-
45
-
46
-
47
-
48
-
49
-
50
-
51
-
52
-
53
-
54
-
55
-
56
-
57
-
58
-
59
-
60
-
61
-
62
-
63
-
 64
64 -
 65
65 -
 66
66 -
 67
67 -
 68
68 -
 69
69 -
 70
70 -
 71
71 -
 72
72 -
 73
73 -
 74
74 -
 75
75 -
 76
76 -
 77
77 -
 78
78 -
 79
79 -
 80
80 -
 81
81 -
 82
82 -
 83
83 -
 84
84 -
85
-
86
-
87
-
88
-
89
-
90
-
91
-
92
-
93
-
94
-
95
-
96
-
97
-
98
-
99
-
100
-
101
-
102
-
103
-
104
-
105
-
106
-
107
-
108
-
109
-
110
-
111
-
112
-
113
-
114
-
115
-
116
-
117
-
118
-
119
-
120
-
121
-
122
-
123
-
124
-
125
-
126
-
127
-
128
-
129
-
130
-
131
-
132
-
133
-
134
-
135
-
136
-
137
-
138
-
139
-
140
-
141
-
142
-
143
-
144
-
145
-
146
-
147
-
148
-
149
-
150
-
151
-
152
-
153
-
154
-
155
-
156
-
157
-
158
-
159
-
160
-
161
-
162
-
163
-
164
-
165
-
166
-
167
-
168
-
169
-
170
-
171
-
172
-
173
-
174
-
175
-
176
-
177
-
178
-
179
-
180
-
181
-
182
-
183
-
184
-
185
-
186
-
187
-
188
-
189
-
190
-
191
-
192
-
193
-
194
-
195
-
196
-
197
-
198
-
199
-
200
-
201
-
202
-
203
-
204
-
205
-
206
-
207
-
208
-
209
-
210
-
211
-
212
-
213
-
214
-
215
 |
 |

1to24
months
25 to 48
months
More than
48 months
After
Dec. 31,
2004
(1)
Total
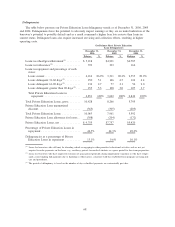
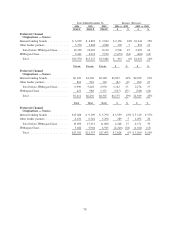
Months Since Entering Repayment
December 31, 2004
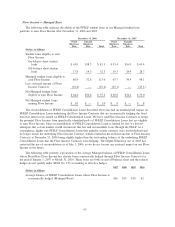
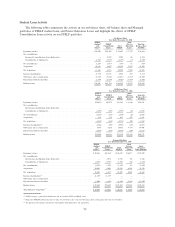
Loans in-school/grace/deferment ........... $ — $ — $ — $5,409 $ 5,409
Loans in forbearance.................... 350 103 47 — 500
Loans in repayment — current............. 3,228 1,401 1,117 — 5,746
Loans in repayment — delinquent 31-60 days. . 110 59 39 — 208
Loans in repayment — delinquent 61-90 days. . 43 26 15 — 84
Loans in repayment — delinquent greater than
90 days ............................ 67 56 33 — 156
Total ............................... $3,798 $1,645 $1,251 $5,409 $12,103
Unamortized discount ................... (306)
Allowance for loan losses ................ (315)
Total Managed Private Education Loans, net . . $11,482
Loans in forbearance as a percentage of loans
in repayment and forbearance ........... 9.2% 6.3% 3.8% —% 7.5%
(1)
Includes all loans in-school/grace/deferment.
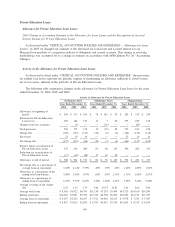
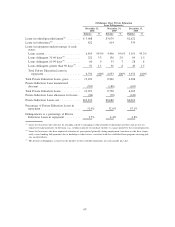
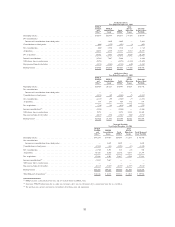
The table below stratifies the portfolio of Managed Private Education Loans in forbearance by the
cumulative number of months the borrower has used forbearance as of the dates indicated. As detailed in the
table below, 4 percent of loans currently in forbearance have cumulative forbearance of more than 24 months,
which is a decrease from the prior two years.
Forbearance
Balance
%of
Total
Forbearance
Balance
%of
Total
Forbearance
Balance
%of
Total
December 31, 2006 December 31, 2005 December 31, 2004
Cumulative number of months
borrower has used forbearance
Up to 12 months .............. $ 870 74% $686 75% $334 66%
13 to 24 months ............... 262 22 165 18 117 24
25 to 36 months ............... 36 3 44 5 30 6
More than 36 months ........... 13 1 22 2 19 4
Total ....................... $1,181 100% $917 100% $500 100%
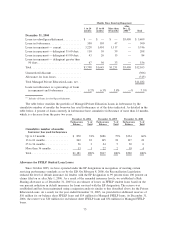
Allowance for FFELP Student Loan Losses
Since October 2005, we have operated under the EP designation in recognition of meeting certain
servicing performance standards as set by the ED. On February 8, 2006, the Reconciliation Legislation
reduced the level of default insurance for lenders with the EP designation to 99 percent from 100 percent on
claims filed on or after July 1, 2006. As a result of the amended insurance levels, we established a Risk
Sharing allowance as of December 31, 2005 for an estimate of losses on FFELP student loans based on the
one percent reduction in default insurance for loans serviced with the EP designation. The reserve was
established and has been maintained using a migration analysis similar to that described above for the Private
Education Loans. As a result, for the year ended December 31, 2005, we provided for additional reserves of
$10 million for on-balance sheet FFELP loans and $19 million for Managed FFELP loans. At December 31,
2006, the reserve was $20 million for on-balance sheet FFELP loans and $34 million for Managed FFELP
loans.
73