Sallie Mae 2006 Annual Report Download - page 95
Download and view the complete annual report
Please find page 95 of the 2006 Sallie Mae annual report below. You can navigate through the pages in the report by either clicking on the pages listed below, or by using the keyword search tool below to find specific information within the annual report.-
 1
1 -
2
-
3
-
4
-
5
-
6
-
7
-
8
-
9
-
10
-
11
-
12
-
13
-
14
-
15
-
16
-
17
-
18
-
19
-
20
-
21
-
22
-
23
-
24
-
25
-
26
-
27
-
28
-
29
-
30
-
31
-
32
-
33
-
34
-
35
-
36
-
37
-
38
-
39
-
40
-
41
-
42
-
43
-
44
-
45
-
46
-
47
-
48
-
49
-
50
-
51
-
52
-
53
-
54
-
55
-
56
-
57
-
58
-
59
-
60
-
61
-
62
-
63
-
64
-
65
-
66
-
67
-
68
-
69
-
70
-
71
-
72
-
73
-
74
-
75
-
76
-
77
-
78
-
79
-
80
-
81
-
82
-
83
-
84
-
 85
85 -
 86
86 -
 87
87 -
 88
88 -
 89
89 -
 90
90 -
 91
91 -
 92
92 -
 93
93 -
 94
94 -
 95
95 -
 96
96 -
 97
97 -
 98
98 -
 99
99 -
 100
100 -
 101
101 -
 102
102 -
 103
103 -
 104
104 -
 105
105 -
106
-
107
-
108
-
109
-
110
-
111
-
112
-
113
-
114
-
115
-
116
-
117
-
118
-
119
-
120
-
121
-
122
-
123
-
124
-
125
-
126
-
127
-
128
-
129
-
130
-
131
-
132
-
133
-
134
-
135
-
136
-
137
-
138
-
139
-
140
-
141
-
142
-
143
-
144
-
145
-
146
-
147
-
148
-
149
-
150
-
151
-
152
-
153
-
154
-
155
-
156
-
157
-
158
-
159
-
160
-
161
-
162
-
163
-
164
-
165
-
166
-
167
-
168
-
169
-
170
-
171
-
172
-
173
-
174
-
175
-
176
-
177
-
178
-
179
-
180
-
181
-
182
-
183
-
184
-
185
-
186
-
187
-
188
-
189
-
190
-
191
-
192
-
193
-
194
-
195
-
196
-
197
-
198
-
199
-
200
-
201
-
202
-
203
-
204
-
205
-
206
-
207
-
208
-
209
-
210
-
211
-
212
-
213
-
214
-
215
 |
 |

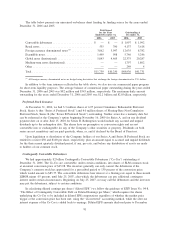
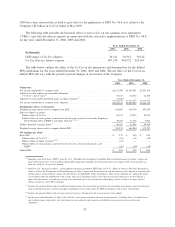
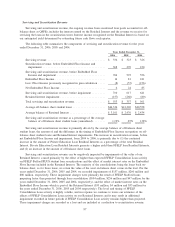
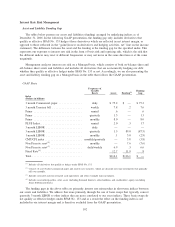
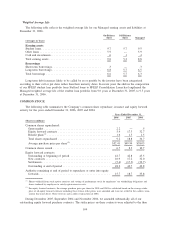
The following table summarizes our securitization activity for the years ended December 31, 2006, 2005
and 2004. Those securitizations listed as sales are off-balance sheet transactions and those listed as financings
remain on-balance sheet.
No. of
Transactions
Amount
Securitized
Pre-Tax
Gain
Gain
%
No. of
Transactions
Amount
Securitized
Pre-Tax
Gain
Gain
%
No. of
Transactions
Amount
Securitized
Pre-Tax
Gain
Gain
%
2006 2005 2004
Years Ended December 31,
(Dollars in millions)
Securitizations — sales:
FFELP Stafford and Other
student loans . ....... 2 $5,004 $ 17 .3% 3 $ 6,533 $ 68 1.1% 4 $10,002 $134 1.3%
FFELP Consolidation
Loans ............ 4 9,503 55 .6 2 4,011 31 .8 — — — —
Private Education Loans . . . 3 5,088 830 16.3 2 3,005 453 15.1 2 2,535 241 9.5
Total securitizations —
sales . ............ 9 19,595 $902 4.6% 7 13,549 $552 4.1% 6 12,537 $375 3.0%
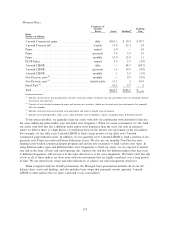
Securitizations —
financings:
Asset-backed commercial
paper
(1)
........... — — — — 1 4,186
FFELP Consolidation
Loans
(2)
........... 4 12,506 5 12,503 6 17,124
Total securitizations —
financings . . . ....... 4 12,506 5 12,503 7 21,310
Total securitizations . . . . . 13 $32,101 12 $26,052 13 $33,847
(1)
The ABCP is a revolving multi-seller conduit that allows the Company to borrow up to $6 billion. The Company may purchase loans
out of this trust at its discretion and as a result, the trust does not qualify as a QSPE and is accounted for on balance sheet as a
variable interest entity (“VIE”).
(2)
In certain FFELP Consolidation Loan securitizations there are terms within the deal structure that result in such securitizations not
qualifying for sale treatment and accordingly, they are accounted for on-balance sheet as variable interest entities VIEs. Terms that
prevent sale treatment include: (1) allowing us to hold certain rights that can affect the remarketing of certain bonds, (2) allowing the
trust to enter into interest rate cap agreements after the initial settlement of the securitization, which do not relate to the reissuance of
third party beneficial interests or (3) allowing us to hold an unconditional call option related to a certain percentage of the securitized
assets.
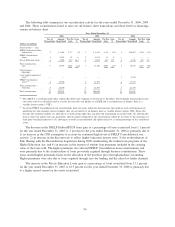
The decrease in the FFELP Stafford/PLUS loans gain as a percentage of loans securitized from 1.1 percent
for the year ended December 31, 2005 to .3 percent for the year ended December 31, 2006 is primarily due to:
1) an increase in the CPR assumption to account for continued high levels of FFELP Consolidation Loan
activity; 2) an increase in the discount rate to reflect higher long-term interest rates; 3) the re-introduction of
Risk Sharing with the Reconciliation Legislation during 2005 reauthorizing the student loan programs of the
Higher Education Act; and 4) an increase in the amount of student loan premiums included in the carrying
value of the loans sold. The higher premiums also affected FFELP Consolidation Loan securitizations and
were primarily due to the securitization of loans previously acquired through business combinations. These
loans carried higher premiums based on the allocation of the purchase price through purchase accounting.
Higher premiums were also due to loans acquired through zero-fee lending and the school-as-lender channels.
The increase in the Private Education Loans gain as a percentage of loans securitized from 15.1 percent
for the year ended December 31, 2005 to 16.3 percent for the year ended December 31, 2006 is primarily due
to a higher spread earned on the assets securitized.
94