Sallie Mae 2006 Annual Report Download - page 32
Download and view the complete annual report
Please find page 32 of the 2006 Sallie Mae annual report below. You can navigate through the pages in the report by either clicking on the pages listed below, or by using the keyword search tool below to find specific information within the annual report.-
 1
1 -
2
-
3
-
4
-
5
-
6
-
7
-
8
-
9
-
10
-
11
-
12
-
13
-
14
-
15
-
16
-
17
-
18
-
19
-
20
-
21
-
 22
22 -
 23
23 -
 24
24 -
 25
25 -
 26
26 -
 27
27 -
 28
28 -
 29
29 -
 30
30 -
 31
31 -
 32
32 -
 33
33 -
 34
34 -
 35
35 -
 36
36 -
 37
37 -
 38
38 -
 39
39 -
 40
40 -
 41
41 -
 42
42 -
43
-
44
-
45
-
46
-
47
-
48
-
49
-
50
-
51
-
52
-
53
-
54
-
55
-
56
-
57
-
58
-
59
-
60
-
61
-
62
-
63
-
64
-
65
-
66
-
67
-
68
-
69
-
70
-
71
-
72
-
73
-
74
-
75
-
76
-
77
-
78
-
79
-
80
-
81
-
82
-
83
-
84
-
85
-
86
-
87
-
88
-
89
-
90
-
91
-
92
-
93
-
94
-
95
-
96
-
97
-
98
-
99
-
100
-
101
-
102
-
103
-
104
-
105
-
106
-
107
-
108
-
109
-
110
-
111
-
112
-
113
-
114
-
115
-
116
-
117
-
118
-
119
-
120
-
121
-
122
-
123
-
124
-
125
-
126
-
127
-
128
-
129
-
130
-
131
-
132
-
133
-
134
-
135
-
136
-
137
-
138
-
139
-
140
-
141
-
142
-
143
-
144
-
145
-
146
-
147
-
148
-
149
-
150
-
151
-
152
-
153
-
154
-
155
-
156
-
157
-
158
-
159
-
160
-
161
-
162
-
163
-
164
-
165
-
166
-
167
-
168
-
169
-
170
-
171
-
172
-
173
-
174
-
175
-
176
-
177
-
178
-
179
-
180
-
181
-
182
-
183
-
184
-
185
-
186
-
187
-
188
-
189
-
190
-
191
-
192
-
193
-
194
-
195
-
196
-
197
-
198
-
199
-
200
-
201
-
202
-
203
-
204
-
205
-
206
-
207
-
208
-
209
-
210
-
211
-
212
-
213
-
214
-
215
 |
 |

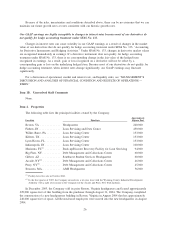
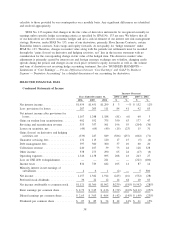
Item 6. Selected Financial Data
Selected Financial Data 2002-2006
(Dollars in millions, except per share amounts)
The following table sets forth selected financial and other operating information of the Company. The
selected financial data in the table is derived from the consolidated financial statements of the Company. The
data should be read in conjunction with the consolidated financial statements, related notes, and “MANAGE-
MENT’S DISCUSSION AND ANALYSIS OF FINANCIAL CONDITION AND RESULTS OF OPERA-
TIONS” included in this Form 10-K.
2006 2005 2004 2003 2002
Operating Data:
Net interest income ......................... $ 1,454 $ 1,451 $ 1,299 $ 1,326 $ 1,425
Net income . . . ............................ 1,157 1,382 1,914 1,534 792
Basic earnings per common share, before cumulative
effect of accounting change ................. 2.73 3.25 4.36 3.08 1.69
Basic earnings per common share, after cumulative
effect of accounting change ................. 2.73 3.25 4.36 3.37 1.69
Diluted earnings per common share, before
cumulative effect of accounting change ......... 2.63 3.05 4.04 2.91 1.64
Diluted earnings per common share, after cumulative
effect of accounting change ................. 2.63 3.05 4.04 3.18 1.64
Dividends per common share .................. .97 .85 .74 .59 .28
Return on common stockholders’ equity .......... 32% 45% 73% 66% 46%
Net interest margin ......................... 1.54 1.77 1.92 2.53 2.92
Return on assets ........................... 1.22 1.68 2.80 2.89 1.60
Dividend payout ratio ....................... 37 28 18 19 17
Average equity/average assets.................. 3.98 3.82 3.73 4.19 3.44
Balance Sheet Data:
Student loans, net .......................... $ 95,920 $82,604 $65,981 $50,047 $42,339
Total assets . . . ............................ 116,136 99,339 84,094 64,611 53,175
Total borrowings ........................... 108,087 91,929 78,122 58,543 47,861
Stockholders’ equity......................... 4,360 3,792 3,102 2,630 1,998
Book value per common share ................. 9.24 7.81 6.93 5.51 4.00
Other Data:
Off-balance sheet securitized student loans, net ..... $ 46,172 $39,925 $41,457 $38,742 $35,785
31