Sallie Mae 2006 Annual Report Download - page 98
Download and view the complete annual report
Please find page 98 of the 2006 Sallie Mae annual report below. You can navigate through the pages in the report by either clicking on the pages listed below, or by using the keyword search tool below to find specific information within the annual report.-
 1
1 -
2
-
3
-
4
-
5
-
6
-
7
-
8
-
9
-
10
-
11
-
12
-
13
-
14
-
15
-
16
-
17
-
18
-
19
-
20
-
21
-
22
-
23
-
24
-
25
-
26
-
27
-
28
-
29
-
30
-
31
-
32
-
33
-
34
-
35
-
36
-
37
-
38
-
39
-
40
-
41
-
42
-
43
-
44
-
45
-
46
-
47
-
48
-
49
-
50
-
51
-
52
-
53
-
54
-
55
-
56
-
57
-
58
-
59
-
60
-
61
-
62
-
63
-
64
-
65
-
66
-
67
-
68
-
69
-
70
-
71
-
72
-
73
-
74
-
75
-
76
-
77
-
78
-
79
-
80
-
81
-
82
-
83
-
84
-
85
-
86
-
87
-
 88
88 -
 89
89 -
 90
90 -
 91
91 -
 92
92 -
 93
93 -
 94
94 -
 95
95 -
 96
96 -
 97
97 -
 98
98 -
 99
99 -
 100
100 -
 101
101 -
 102
102 -
 103
103 -
 104
104 -
 105
105 -
 106
106 -
 107
107 -
 108
108 -
109
-
110
-
111
-
112
-
113
-
114
-
115
-
116
-
117
-
118
-
119
-
120
-
121
-
122
-
123
-
124
-
125
-
126
-
127
-
128
-
129
-
130
-
131
-
132
-
133
-
134
-
135
-
136
-
137
-
138
-
139
-
140
-
141
-
142
-
143
-
144
-
145
-
146
-
147
-
148
-
149
-
150
-
151
-
152
-
153
-
154
-
155
-
156
-
157
-
158
-
159
-
160
-
161
-
162
-
163
-
164
-
165
-
166
-
167
-
168
-
169
-
170
-
171
-
172
-
173
-
174
-
175
-
176
-
177
-
178
-
179
-
180
-
181
-
182
-
183
-
184
-
185
-
186
-
187
-
188
-
189
-
190
-
191
-
192
-
193
-
194
-
195
-
196
-
197
-
198
-
199
-
200
-
201
-
202
-
203
-
204
-
205
-
206
-
207
-
208
-
209
-
210
-
211
-
212
-
213
-
214
-
215
 |
 |

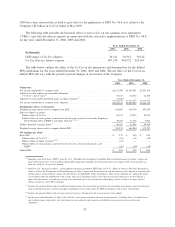
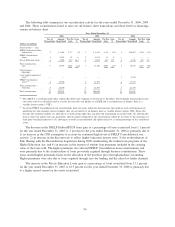
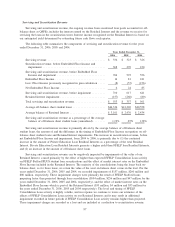
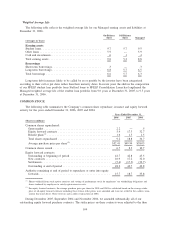
Servicing and Securitization Revenue
Servicing and securitization revenue, the ongoing revenue from securitized loan pools accounted for off-
balance sheet as QSPEs, includes the interest earned on the Residual Interest and the revenue we receive for
servicing the loans in the securitization trusts. Interest income recognized on the Residual Interest is based on
our anticipated yield determined by estimating future cash flows each quarter.
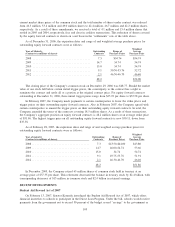
The following table summarizes the components of servicing and securitization revenue for the years
ended December 31, 2006, 2005 and 2004.
2006 2005 2004
Years Ended December 31,
Servicing revenue ..................................... $ 336 $ 323 $ 326
Securitization revenue, before Embedded Floor Income and
impairment . ....................................... 368 270 230
Servicing and securitization revenue, before Embedded Floor
Income and impairment ............................... 704 593 556
Embedded Floor Income ................................ 14 81 241
Less: Floor Income previously recognized in gain calculation ..... (8) (57) (156)
Net Embedded Floor Income ............................. 6 24 85
Servicing and securitization revenue, before impairment ......... 710 617 641
Retained Interest impairment ............................. (157) (260) (80)
Total servicing and securitization revenue .................... $ 553 $ 357 $ 561
Average off-balance sheet student loans ..................... $46,336 $41,220 $40,558
Average balance of Retained Interest ....................... $ 3,101 $ 2,476 $ 2,434
Servicing and securitization revenue as a percentage of the average
balance of off-balance sheet student loans (annualized) ........ 1.19% .87% 1.38%
Servicing and securitization revenue is primarily driven by the average balance of off-balance sheet
student loans, the amount of and the difference in the timing of Embedded Floor Income recognition on off-
balance sheet student loans and Retained Interest impairments. The increase in securitization revenue, before
net Embedded Floor Income and impairment, from 2004 to 2006, is primarily due to (1) the continued
increase in the amount of Private Education Loan Residual Interests as a percentage of the total Residual
Interest. Private Education Loan Residual Interests generate a higher yield than FFELP loan Residual Interests,
and (2) an increase in the amount of off-balance sheet loans.
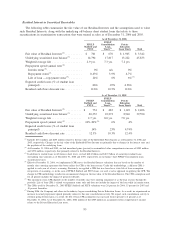
Servicing and securitization revenue can be negatively impacted by impairments of the value of our
Retained Interest, caused primarily by the effect of higher than expected FFELP Consolidation Loan activity
on FFELP Stafford/PLUS student loan securitizations and the effect of market interest rates on the Embedded
Floor Income included in the Retained Interest. The majority of the consolidations bring the loans back on-
balance sheet, so for those loans, we retain the value of the asset on-balance sheet versus in the trust. For the
years ended December 31, 2006, 2005 and 2004, we recorded impairments of $157 million, $260 million and
$80 million, respectively. These impairment charges were primarily the result of FFELP Stafford loans
prepaying faster than projected through loan consolidation ($104 million, $256 million and $47 million for the
years ended December 31, 2006, 2005 and 2004, respectively), and the effect of market interest rates on the
Embedded Floor Income which is part of the Retained Interest ($53 million, $4 million and $33 million for
the years ended December 31, 2006, 2005 and 2004 respectively). The level and timing of FFELP
Consolidation Loan activity is highly volatile, and in response we continue to revise our estimates of the
effects of FFELP Consolidation Loan activity on our Retained Interests and it may result in additional
impairment recorded in future periods if FFELP Consolidation Loan activity remains higher than projected.
These impairment charges are recorded as a loss and are included as a reduction to securitization revenue.
97