Sallie Mae 2006 Annual Report Download - page 89
Download and view the complete annual report
Please find page 89 of the 2006 Sallie Mae annual report below. You can navigate through the pages in the report by either clicking on the pages listed below, or by using the keyword search tool below to find specific information within the annual report.-
 1
1 -
2
-
3
-
4
-
5
-
6
-
7
-
8
-
9
-
10
-
11
-
12
-
13
-
14
-
15
-
16
-
17
-
18
-
19
-
20
-
21
-
22
-
23
-
24
-
25
-
26
-
27
-
28
-
29
-
30
-
31
-
32
-
33
-
34
-
35
-
36
-
37
-
38
-
39
-
40
-
41
-
42
-
43
-
44
-
45
-
46
-
47
-
48
-
49
-
50
-
51
-
52
-
53
-
54
-
55
-
56
-
57
-
58
-
59
-
60
-
61
-
62
-
63
-
64
-
65
-
66
-
67
-
68
-
69
-
70
-
71
-
72
-
73
-
74
-
75
-
76
-
77
-
78
-
 79
79 -
 80
80 -
 81
81 -
 82
82 -
 83
83 -
 84
84 -
 85
85 -
 86
86 -
 87
87 -
 88
88 -
 89
89 -
 90
90 -
 91
91 -
 92
92 -
 93
93 -
 94
94 -
 95
95 -
 96
96 -
 97
97 -
 98
98 -
 99
99 -
100
-
101
-
102
-
103
-
104
-
105
-
106
-
107
-
108
-
109
-
110
-
111
-
112
-
113
-
114
-
115
-
116
-
117
-
118
-
119
-
120
-
121
-
122
-
123
-
124
-
125
-
126
-
127
-
128
-
129
-
130
-
131
-
132
-
133
-
134
-
135
-
136
-
137
-
138
-
139
-
140
-
141
-
142
-
143
-
144
-
145
-
146
-
147
-
148
-
149
-
150
-
151
-
152
-
153
-
154
-
155
-
156
-
157
-
158
-
159
-
160
-
161
-
162
-
163
-
164
-
165
-
166
-
167
-
168
-
169
-
170
-
171
-
172
-
173
-
174
-
175
-
176
-
177
-
178
-
179
-
180
-
181
-
182
-
183
-
184
-
185
-
186
-
187
-
188
-
189
-
190
-
191
-
192
-
193
-
194
-
195
-
196
-
197
-
198
-
199
-
200
-
201
-
202
-
203
-
204
-
205
-
206
-
207
-
208
-
209
-
210
-
211
-
212
-
213
-
214
-
215
 |
 |

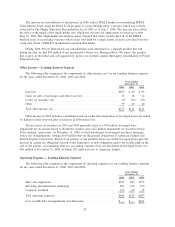
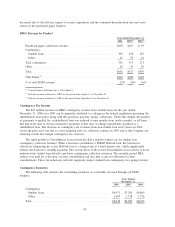
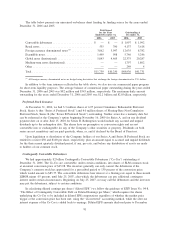
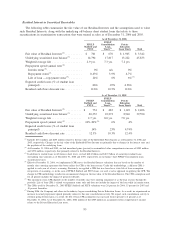
Fee and Other Income — Corporate and Other Business Segment
The following table summarizes the components of fee and other income for our Corporate and Other
business segment for the years ended December 31, 2006, 2005 and 2004.
2006 2005 2004
Years Ended
December 31,
Guarantor servicing fees ....................................... $132 $115 $120
Loan servicing fees ........................................... 29 44 52
Upromise .................................................. 42 — —
Other ..................................................... 84 81 78
Total fee and other income ..................................... $287 $240 $250
USA Funds, the nation’s largest guarantee agency, accounted for 83 percent, 82 percent, and 85 percent,
respectively, of guarantor servicing fees and 25 percent, 27 percent, and 16 percent, respectively, of revenues
associated with other products and services for the years ended December 31, 2006, 2005 and 2004.
2006 versus 2005
The increase in guarantor servicing fees in 2006 versus 2005 is primarily due to a negotiated settlement
with USA Funds such that USA Funds was able to pay account maintenance fees that were previously held up
by the cap on payments from ED to guarantors in 2005. This cap was removed by legislation reauthorizing the
student loan programs of the Higher Education Act on October 1, 2006.
2005 versus 2004
The decrease is guarantor servicing fees in 2005 versus 2004 is due to the full year effect of the lower
issuance fee rate, the result of the reduction in the issuance fee from 65 basis points to 40 basis points, and to
an $8 million reduction in account maintenance fees caused by a cap on payments from ED to guarantors,
discussed above.
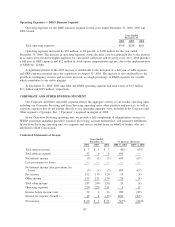
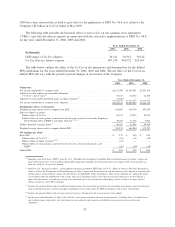
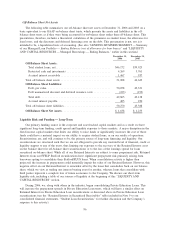
Operating Expenses — Corporate and Other Business Segment
The following table summarizes the components of operating expenses for our Corporate and Other
operating segment.
2006 2005 2004
Years Ended
December 31,
Operating expenses ........................................... $148 $149 $152
Upromise .................................................. 33 — —
General and administrative expenses .............................. 69 86 59
Total operating expenses ....................................... $250 $235 $211
Operating expenses include direct costs incurred to perform guarantor servicing on behalf of guarantor
agencies and to service loans for unrelated third parties, as well as information technology expenses related to
these functions. General and administrative expenses include unallocated corporate overhead expenses for
centralized headquarters functions such as executive management, accounting and finance, human resources
and marketing.
2006 versus 2005
In 2006, operating expenses in the Corporate and Other segment include $17 million of stock option
compensation expense, due to the implementation of SFAS No. 123(R) and the expenses of Upromise,
acquired in August 2006. The decrease in general and administrative expenses is due to a $14 million net
88