Sallie Mae 2006 Annual Report Download - page 87
Download and view the complete annual report
Please find page 87 of the 2006 Sallie Mae annual report below. You can navigate through the pages in the report by either clicking on the pages listed below, or by using the keyword search tool below to find specific information within the annual report.-
 1
1 -
2
-
3
-
4
-
5
-
6
-
7
-
8
-
9
-
10
-
11
-
12
-
13
-
14
-
15
-
16
-
17
-
18
-
19
-
20
-
21
-
22
-
23
-
24
-
25
-
26
-
27
-
28
-
29
-
30
-
31
-
32
-
33
-
34
-
35
-
36
-
37
-
38
-
39
-
40
-
41
-
42
-
43
-
44
-
45
-
46
-
47
-
48
-
49
-
50
-
51
-
52
-
53
-
54
-
55
-
56
-
57
-
58
-
59
-
60
-
61
-
62
-
63
-
64
-
65
-
66
-
67
-
68
-
69
-
70
-
71
-
72
-
73
-
74
-
75
-
76
-
 77
77 -
 78
78 -
 79
79 -
 80
80 -
 81
81 -
 82
82 -
 83
83 -
 84
84 -
 85
85 -
 86
86 -
 87
87 -
 88
88 -
 89
89 -
 90
90 -
 91
91 -
 92
92 -
 93
93 -
 94
94 -
 95
95 -
 96
96 -
 97
97 -
98
-
99
-
100
-
101
-
102
-
103
-
104
-
105
-
106
-
107
-
108
-
109
-
110
-
111
-
112
-
113
-
114
-
115
-
116
-
117
-
118
-
119
-
120
-
121
-
122
-
123
-
124
-
125
-
126
-
127
-
128
-
129
-
130
-
131
-
132
-
133
-
134
-
135
-
136
-
137
-
138
-
139
-
140
-
141
-
142
-
143
-
144
-
145
-
146
-
147
-
148
-
149
-
150
-
151
-
152
-
153
-
154
-
155
-
156
-
157
-
158
-
159
-
160
-
161
-
162
-
163
-
164
-
165
-
166
-
167
-
168
-
169
-
170
-
171
-
172
-
173
-
174
-
175
-
176
-
177
-
178
-
179
-
180
-
181
-
182
-
183
-
184
-
185
-
186
-
187
-
188
-
189
-
190
-
191
-
192
-
193
-
194
-
195
-
196
-
197
-
198
-
199
-
200
-
201
-
202
-
203
-
204
-
205
-
206
-
207
-
208
-
209
-
210
-
211
-
212
-
213
-
214
-
215
 |
 |

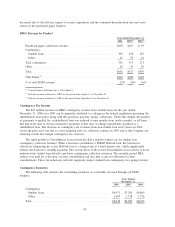
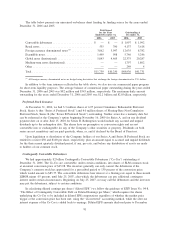
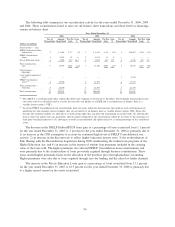
Purchased Paper
Our purchased paper collection business is comprised of the purchase of delinquent and charged off
consumer receivables, primarily credit cards and the purchase of distressed mortgage receivables. Since these
businesses operate in different segments of the marketplace with the primary distinguishing factor being the
existence of collateral for the mortgage receivable, we have broken out their results separately in the
presentations below.
Non-Mortgage
2006 2005 2004
(1)
Years Ended
December 31,
Face value of purchases .................................... $3,438 $2,826 $426
Purchase price ........................................... 278 198 19
% of face value purchased .................................. 8.1% 7.0% 4.5%
Gross Cash Collections (“GCC”) .............................. $ 348 $ 250 $ 59
Collections revenue. ....................................... 199 157 39
%ofGCC .............................................. 56% 63% 66%
Carrying value ........................................... $ 274 $ 158 $ 52
(1)
AFS was purchased in September 2004, so the results for that year reflect only three months of activity.
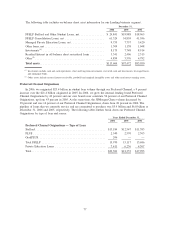
The amount of face value of purchases in any quarter is a function of a combination of factors including
the amount of receivables available for purchase in the marketplace, average age of each portfolio, the asset
class of the receivables, and competition in the marketplace. As a result, the percentage of principal purchased
will vary from quarter to quarter. The decrease in purchase paper revenue as a percentage of GCC can
primarily be attributed to the increase in new portfolio purchases in the second half of 2005. Typically,
revenue recognition based on a portfolio’s effective yield rate is a lower percentage of cash collections in the
early stages of servicing a portfolio. On both December 22, 2005, and December 29, 2006, we acquired an
additional 12 percent ownership stake in AFS, increasing our ownership first to 76 percent and then to
88 percent.
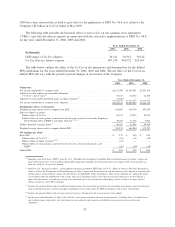
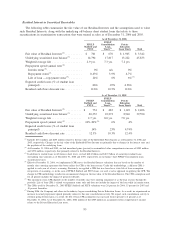
Mortgage/Properties
On August 31, 2005, we acquired 100 percent of GRP, a debt management company that acquires and
manages portfolios of sub-performing and non-performing mortgage loans, substantially all of which are
secured by one-to-four family residential real estate. GRP was purchased in August 2005, so the results for
that year ended reflect only four months of activity.
2006 2005
Years Ended
December 31,
Face value of purchases .............................................. $556 $165
Collections revenue ................................................. 40 10
Collateral value of purchases .......................................... 607 195
Purchase price ..................................................... 462 141
% of collateral value ................................................ 76% 72%
Carrying value of purchases ........................................... $518 $298
The purchase price for sub-performing and non-performing mortgage loans is generally determined as a
percentage of the underlying collateral. Fluctuations in the purchase price as a percentage of collateral value
can be caused by a number of factors including cash flow characteristics, targeted yield, expected holding
period, the percentage of second mortgages in the portfolio and the level of private mortgage insurance
associated with particular assets.
86