Sallie Mae 2006 Annual Report Download - page 10
Download and view the complete annual report
Please find page 10 of the 2006 Sallie Mae annual report below. You can navigate through the pages in the report by either clicking on the pages listed below, or by using the keyword search tool below to find specific information within the annual report.-
 1
1 -
 2
2 -
 3
3 -
 4
4 -
 5
5 -
 6
6 -
 7
7 -
 8
8 -
 9
9 -
 10
10 -
 11
11 -
 12
12 -
 13
13 -
 14
14 -
 15
15 -
 16
16 -
 17
17 -
 18
18 -
 19
19 -
 20
20 -
 21
21 -
22
-
23
-
24
-
25
-
26
-
27
-
28
-
29
-
30
-
31
-
32
-
33
-
34
-
35
-
36
-
37
-
38
-
39
-
40
-
41
-
42
-
43
-
44
-
45
-
46
-
47
-
48
-
49
-
50
-
51
-
52
-
53
-
54
-
55
-
56
-
57
-
58
-
59
-
60
-
61
-
62
-
63
-
64
-
65
-
66
-
67
-
68
-
69
-
70
-
71
-
72
-
73
-
74
-
75
-
76
-
77
-
78
-
79
-
80
-
81
-
82
-
83
-
84
-
85
-
86
-
87
-
88
-
89
-
90
-
91
-
92
-
93
-
94
-
95
-
96
-
97
-
98
-
99
-
100
-
101
-
102
-
103
-
104
-
105
-
106
-
107
-
108
-
109
-
110
-
111
-
112
-
113
-
114
-
115
-
116
-
117
-
118
-
119
-
120
-
121
-
122
-
123
-
124
-
125
-
126
-
127
-
128
-
129
-
130
-
131
-
132
-
133
-
134
-
135
-
136
-
137
-
138
-
139
-
140
-
141
-
142
-
143
-
144
-
145
-
146
-
147
-
148
-
149
-
150
-
151
-
152
-
153
-
154
-
155
-
156
-
157
-
158
-
159
-
160
-
161
-
162
-
163
-
164
-
165
-
166
-
167
-
168
-
169
-
170
-
171
-
172
-
173
-
174
-
175
-
176
-
177
-
178
-
179
-
180
-
181
-
182
-
183
-
184
-
185
-
186
-
187
-
188
-
189
-
190
-
191
-
192
-
193
-
194
-
195
-
196
-
197
-
198
-
199
-
200
-
201
-
202
-
203
-
204
-
205
-
206
-
207
-
208
-
209
-
210
-
211
-
212
-
213
-
214
-
215
 |
 |

management of $142.1 billion in Managed student loans as of December 31, 2006, of which $119.5 billion or
84 percent are federally insured. We serve a diverse range of clients that includes over 6,000 educational and
financial institutions and state agencies. We are the largest servicer of FFELP student loans, servicing a
portfolio of $115.2 billion of FFELP student loans. We also service $25 billion of Private Education Loans as
of December 31, 2006. We also market student loans, both federal and private, directly to the consumer. In
addition to education lending, we also originate mortgage and consumer loans with the intent of selling most
of these loans. In 2006 we originated $1.6 billion in mortgage and consumer loans. Our mortgage and
consumer loan portfolio totaled $612 million at December 31, 2006, of which $119 million are mortgages in
the held-for-sale portfolio.
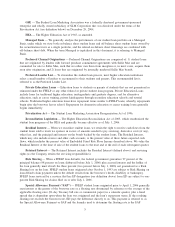
Student Lending Marketplace
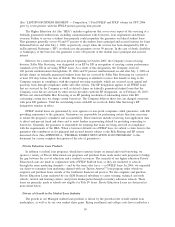
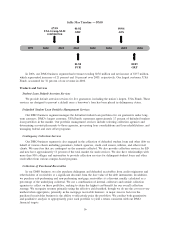
The following chart shows the estimated sources of funding for attending two-year and four-year colleges
for the academic year (“AY”) ending June 30, 2007 (AY 2006-2007). Approximately 42 percent of the funding
comes from federally guaranteed student loans and Private Education Loans. The parent/student contributions
come from savings/investments, current period earnings and other loans obtained without going through the
normal financial aid process.
Sources of Funding for College Attendance — AY 2006-2007
(1)
Total Projected Cost — $229 Billion
(dollars in billions)
$23
$74
$52
$80
Parent/Student
Contributions Federal Student
Loans
Private Education
Loans
Scholarships, Grants, &
Other
(1)
Source: Based on estimates by Octameron Associates, “Don’t Miss Out,” 30th Edition, by College Board,
“2006 Trends in Student Aid” and Sallie Mae. Includes tuition, room, board, transportation and miscellaneous
costs for two and four year college degree-granting programs.
Federally Guaranteed Student Lending Programs
There are two competing programs that provide student loans where the ultimate credit risk lies with the
federal government: the FFELP and the Federal Direct Lending Program (“FDLP”). FFELP loans are provided
by private sector institutions and are ultimately guaranteed by ED. FDLP loans are funded by taxpayers and
provided to borrowers directly by ED on terms similar to student loans in the FFELP. In addition to these
government guaranteed programs, Private Education Loans are made by financial institutions where the lender
or holder assumes the credit risk of the borrower.
For the federal fiscal year (“FFY”) ended September 30, 2006 (FFY 2006), ED estimated that the
FFELP’s market share in federally guaranteed student loans was 79 percent, up from 77 percent in FFY 2005.
9