Sallie Mae 2006 Annual Report Download - page 82
Download and view the complete annual report
Please find page 82 of the 2006 Sallie Mae annual report below. You can navigate through the pages in the report by either clicking on the pages listed below, or by using the keyword search tool below to find specific information within the annual report.-
 1
1 -
2
-
3
-
4
-
5
-
6
-
7
-
8
-
9
-
10
-
11
-
12
-
13
-
14
-
15
-
16
-
17
-
18
-
19
-
20
-
21
-
22
-
23
-
24
-
25
-
26
-
27
-
28
-
29
-
30
-
31
-
32
-
33
-
34
-
35
-
36
-
37
-
38
-
39
-
40
-
41
-
42
-
43
-
44
-
45
-
46
-
47
-
48
-
49
-
50
-
51
-
52
-
53
-
54
-
55
-
56
-
57
-
58
-
59
-
60
-
61
-
62
-
63
-
64
-
65
-
66
-
67
-
68
-
69
-
70
-
71
-
 72
72 -
 73
73 -
 74
74 -
 75
75 -
 76
76 -
 77
77 -
 78
78 -
 79
79 -
 80
80 -
 81
81 -
 82
82 -
 83
83 -
 84
84 -
 85
85 -
 86
86 -
 87
87 -
 88
88 -
 89
89 -
 90
90 -
 91
91 -
 92
92 -
93
-
94
-
95
-
96
-
97
-
98
-
99
-
100
-
101
-
102
-
103
-
104
-
105
-
106
-
107
-
108
-
109
-
110
-
111
-
112
-
113
-
114
-
115
-
116
-
117
-
118
-
119
-
120
-
121
-
122
-
123
-
124
-
125
-
126
-
127
-
128
-
129
-
130
-
131
-
132
-
133
-
134
-
135
-
136
-
137
-
138
-
139
-
140
-
141
-
142
-
143
-
144
-
145
-
146
-
147
-
148
-
149
-
150
-
151
-
152
-
153
-
154
-
155
-
156
-
157
-
158
-
159
-
160
-
161
-
162
-
163
-
164
-
165
-
166
-
167
-
168
-
169
-
170
-
171
-
172
-
173
-
174
-
175
-
176
-
177
-
178
-
179
-
180
-
181
-
182
-
183
-
184
-
185
-
186
-
187
-
188
-
189
-
190
-
191
-
192
-
193
-
194
-
195
-
196
-
197
-
198
-
199
-
200
-
201
-
202
-
203
-
204
-
205
-
206
-
207
-
208
-
209
-
210
-
211
-
212
-
213
-
214
-
215
 |
 |

FFELP
Stafford
and
Other
(1)
FFELP
Consolidation
Loans
Total
FFELP
Total
Private
Education
Loans
Total On-
Balance Sheet
Portfolio
On-Balance Sheet
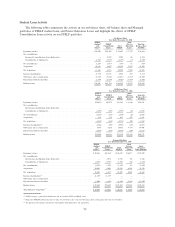
Year Ended December 31, 2004
Beginning balance . . . . . . . . . . . . . . . . . . . . . . . . . . . . . . . . . . . . . . . . . . $18,670 $26,907 $45,577 $ 4,470 $ 50,047
Net consolidations:
Incremental consolidations from third parties. . . . . . . . . . . . . . . . . . . . . . . . . . — 2,609 2,609 — 2,609
Consolidations to third parties . . . . . . . . . . . . . . . . . . . . . . . . . . . . . . . . . . . (666) (225) (891) (4) (895)
Net consolidations . . . . . . . . . . . . . . . . . . . . . . . . . . . . . . . . . . . . . . . . . . (666) 2,384 1,718 (4) 1,714
Acquisitions . . . . . . . . . . . . . . . . . . . . . . . . . . . . . . . . . . . . . . . . . . . . . . 16,458 6,079 22,537 4,033 26,570
Net acquisitions . . . . . . . . . . . . . . . . . . . . . . . . . . . . . . . . . . . . . . . . . . . . 15,792 8,463 24,255 4,029 28,284
Internal consolidations . . . . . . . . . . . . . . . . . . . . . . . . . . . . . . . . . . . . . . . . (2,201) 7,687 5,486 — 5,486
Off-balance sheet securitizations . . . . . . . . . . . . . . . . . . . . . . . . . . . . . . . . . . (9,975) — (9,975) (2,430) (12,405)
Repayments/claims/resales/other . . . . . . . . . . . . . . . . . . . . . . . . . . . . . . . . . . (3,321) (1,461) (4,782) (649) (5,431)
Ending balance . . . . . . . . . . . . . . . . . . . . . . . . . . . . . . . . . . . . . . . . . . . . $18,965 $41,596 $60,561 $ 5,420 $ 65,981
FFELP
Stafford
and
Other
(1)
FFELP
Consolidation
Loans
Total
FFELP
Total
Private
Education
Loans
Total Off-
Balance Sheet
Portfolio
Off-Balance Sheet
Year Ended December 31, 2004
Beginning balance . . . . . . . . . . . . . . . . . . . . . . . . . . . . . . . . . . . . . . . . . . $26,884 $8,023 $34,907 $3,835 $38,742
Net consolidations:
Incremental consolidations from third parties. . . . . . . . . . . . . . . . . . . . . . . . . . — — — — —
Consolidations to third parties . . . . . . . . . . . . . . . . . . . . . . . . . . . . . . . . . . . (1,114) (89) (1,203) (7) (1,210)
Net consolidations . . . . . . . . . . . . . . . . . . . . . . . . . . . . . . . . . . . . . . . . . . (1,114) (89) (1,203) (7) (1,210)
Acquisitions . . . . . . . . . . . . . . . . . . . . . . . . . . . . . . . . . . . . . . . . . . . . . . 378 187 565 172 737
Net acquisitions . . . . . . . . . . . . . . . . . . . . . . . . . . . . . . . . . . . . . . . . . . . . (736) 98 (638) 165 (473)
Internal consolidations
(2)
. . . . . . . . . . . . . . . . . . . . . . . . . . . . . . . . . . . . . . . (5,486) — (5,486) — (5,486)
Off-balance sheet securitizations . . . . . . . . . . . . . . . . . . . . . . . . . . . . . . . . . . 9,975 — 9,975 2,430 12,405
Repayments/claims/resales/other . . . . . . . . . . . . . . . . . . . . . . . . . . . . . . . . . . (2,812) (551) (3,363) (368) (3,731)
Ending balance . . . . . . . . . . . . . . . . . . . . . . . . . . . . . . . . . . . . . . . . . . . . $27,825 $7,570 $35,395 $6,062 $41,457
FFELP
Stafford
and
Other
(1)
FFELP
Consolidation
Loans
Total
FFELP
Total
Private
Education
Loans
Total Managed
Basis Portfolio
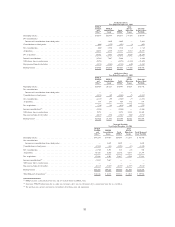
Managed Portfolio
Year Ended December 31, 2004
Beginning balance . . . . . . . . . . . . . . . . . . . . . . . . . . . . . . . . . . . . . . . . . . $45,554 $34,930 $80,484 $ 8,305 $ 88,789
Net consolidations:
Incremental consolidations from third parties . . . . . . . . . . . . . . . . . . . . . . . . . — 2,609 2,609 — 2,609
Consolidations to third parties . . . . . . . . . . . . . . . . . . . . . . . . . . . . . . . . . . . (1,780) (314) (2,094) (11) (2,105)
Net consolidations . . . . . . . . . . . . . . . . . . . . . . . . . . . . . . . . . . . . . . . . . . (1,780) 2,295 515 (11) 504
Acquisitions . . . . . . . . . . . . . . . . . . . . . . . . . . . . . . . . . . . . . . . . . . . . . 16,836 6,266 23,102 4,205 27,307
Net acquisitions . . . . . . . . . . . . . . . . . . . . . . . . . . . . . . . . . . . . . . . . . . . 15,056 8,561 23,617 4,194 27,811
Internal consolidations
(2)
. . . . . . . . . . . . . . . . . . . . . . . . . . . . . . . . . . . . . . (7,687) 7,687 — — —
Off-balance sheet securitizations . . . . . . . . . . . . . . . . . . . . . . . . . . . . . . . . . . — — — — —
Repayments/claims/resales/other . . . . . . . . . . . . . . . . . . . . . . . . . . . . . . . . . . (6,133) (2,012) (8,145) (1,017) (9,162)
Ending balance . . . . . . . . . . . . . . . . . . . . . . . . . . . . . . . . . . . . . . . . . . . $46,790 $49,166 $95,956 $11,482 $107,438
Total Managed Acquisitions
(3)
. . . . . . . . . . . . . . . . . . . . . . . . . . . . . . . . . . . $16,836 $ 8,875 $25,711 $ 4,205 $ 29,916
(1)
FFELP category is primarily Stafford loans and also includes PLUS and HEAL loans.
(2)
Represents FFELP/Stafford loans that we either own on-balance sheet or in our off-balance sheet securitization trusts that we consolidate.
(3)
The purchases line includes incremental consolidations from third parties and acquisitions.
81