Sallie Mae 2006 Annual Report Download - page 59
Download and view the complete annual report
Please find page 59 of the 2006 Sallie Mae annual report below. You can navigate through the pages in the report by either clicking on the pages listed below, or by using the keyword search tool below to find specific information within the annual report.-
 1
1 -
2
-
3
-
4
-
5
-
6
-
7
-
8
-
9
-
10
-
11
-
12
-
13
-
14
-
15
-
16
-
17
-
18
-
19
-
20
-
21
-
22
-
23
-
24
-
25
-
26
-
27
-
28
-
29
-
30
-
31
-
32
-
33
-
34
-
35
-
36
-
37
-
38
-
39
-
40
-
41
-
42
-
43
-
44
-
45
-
46
-
47
-
48
-
 49
49 -
 50
50 -
 51
51 -
 52
52 -
 53
53 -
 54
54 -
 55
55 -
 56
56 -
 57
57 -
 58
58 -
 59
59 -
 60
60 -
 61
61 -
 62
62 -
 63
63 -
 64
64 -
 65
65 -
 66
66 -
 67
67 -
 68
68 -
 69
69 -
70
-
71
-
72
-
73
-
74
-
75
-
76
-
77
-
78
-
79
-
80
-
81
-
82
-
83
-
84
-
85
-
86
-
87
-
88
-
89
-
90
-
91
-
92
-
93
-
94
-
95
-
96
-
97
-
98
-
99
-
100
-
101
-
102
-
103
-
104
-
105
-
106
-
107
-
108
-
109
-
110
-
111
-
112
-
113
-
114
-
115
-
116
-
117
-
118
-
119
-
120
-
121
-
122
-
123
-
124
-
125
-
126
-
127
-
128
-
129
-
130
-
131
-
132
-
133
-
134
-
135
-
136
-
137
-
138
-
139
-
140
-
141
-
142
-
143
-
144
-
145
-
146
-
147
-
148
-
149
-
150
-
151
-
152
-
153
-
154
-
155
-
156
-
157
-
158
-
159
-
160
-
161
-
162
-
163
-
164
-
165
-
166
-
167
-
168
-
169
-
170
-
171
-
172
-
173
-
174
-
175
-
176
-
177
-
178
-
179
-
180
-
181
-
182
-
183
-
184
-
185
-
186
-
187
-
188
-
189
-
190
-
191
-
192
-
193
-
194
-
195
-
196
-
197
-
198
-
199
-
200
-
201
-
202
-
203
-
204
-
205
-
206
-
207
-
208
-
209
-
210
-
211
-
212
-
213
-
214
-
215
 |
 |

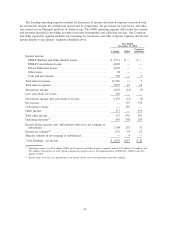
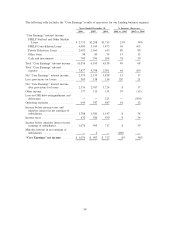
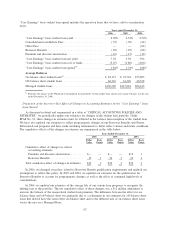
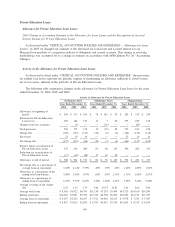
The following table includes the “Core Earnings” results of operations for our Lending business segment.
2006 2005 2004 2006 vs. 2005 2005 vs. 2004
Years Ended December 31, % Increase (Decrease)
“Core Earnings” interest income:
FFELP Stafford and Other Student
Loans ...................... $ 2,771 $2,298 $1,715 21% 34%
FFELP Consolidation Loans ....... 4,690 3,014 1,473 56 105
Private Education Loans .......... 2,092 1,160 613 80 89
Other loans .................... 98 85 74 15 15
Cash and investments ............ 705 396 264 78 50
Total “Core Earnings” interest income . . 10,356 6,953 4,139 49 68
Total “Core Earnings” interest
expense ...................... 7,877 4,798 2,301 64 109
Net “Core Earnings” interest income . . . 2,479 2,155 1,838 15 17
Less: provisions for losses........... 303 138 114 120 21
Net “Core Earnings” interest income
after provisions for losses ......... 2,176 2,017 1,724 8 17
Other income .................... 177 111 131 59 (15)
Loss on GSE debt extinguishment and
defeasance .................... — — 221 — (100)
Operating expenses ................ 645 547 487 18 12
Income before income taxes and
minority interest in net earnings of
subsidiaries .................... 1,708 1,581 1,147 8 38
Income taxes .................... 632 586 430 8 36
Income before minority interest in net
earnings of subsidiaries ........... 1,076 995 717 8 39
Minority interest in net earnings of
subsidiaries .................... — 2 — (100) —
“Core Earnings” net income ........ $ 1,076 $ 993 $ 717 8% 38%
58