Sallie Mae 2006 Annual Report Download - page 192
Download and view the complete annual report
Please find page 192 of the 2006 Sallie Mae annual report below. You can navigate through the pages in the report by either clicking on the pages listed below, or by using the keyword search tool below to find specific information within the annual report.-
 1
1 -
2
-
3
-
4
-
5
-
6
-
7
-
8
-
9
-
10
-
11
-
12
-
13
-
14
-
15
-
16
-
17
-
18
-
19
-
20
-
21
-
22
-
23
-
24
-
25
-
26
-
27
-
28
-
29
-
30
-
31
-
32
-
33
-
34
-
35
-
36
-
37
-
38
-
39
-
40
-
41
-
42
-
43
-
44
-
45
-
46
-
47
-
48
-
49
-
50
-
51
-
52
-
53
-
54
-
55
-
56
-
57
-
58
-
59
-
60
-
61
-
62
-
63
-
64
-
65
-
66
-
67
-
68
-
69
-
70
-
71
-
72
-
73
-
74
-
75
-
76
-
77
-
78
-
79
-
80
-
81
-
82
-
83
-
84
-
85
-
86
-
87
-
88
-
89
-
90
-
91
-
92
-
93
-
94
-
95
-
96
-
97
-
98
-
99
-
100
-
101
-
102
-
103
-
104
-
105
-
106
-
107
-
108
-
109
-
110
-
111
-
112
-
113
-
114
-
115
-
116
-
117
-
118
-
119
-
120
-
121
-
122
-
123
-
124
-
125
-
126
-
127
-
128
-
129
-
130
-
131
-
132
-
133
-
134
-
135
-
136
-
137
-
138
-
139
-
140
-
141
-
142
-
143
-
144
-
145
-
146
-
147
-
148
-
149
-
150
-
151
-
152
-
153
-
154
-
155
-
156
-
157
-
158
-
159
-
160
-
161
-
162
-
163
-
164
-
165
-
166
-
167
-
168
-
169
-
170
-
171
-
172
-
173
-
174
-
175
-
176
-
177
-
178
-
179
-
180
-
181
-
 182
182 -
 183
183 -
 184
184 -
 185
185 -
 186
186 -
 187
187 -
 188
188 -
 189
189 -
 190
190 -
 191
191 -
 192
192 -
 193
193 -
 194
194 -
 195
195 -
 196
196 -
 197
197 -
 198
198 -
 199
199 -
 200
200 -
 201
201 -
 202
202 -
203
-
204
-
205
-
206
-
207
-
208
-
209
-
210
-
211
-
212
-
213
-
214
-
215
 |
 |
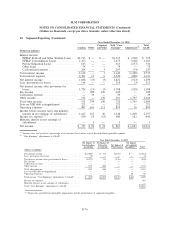
18. Segment Reporting (Continued)
recently acquired Upromise operating segments. Corporate and Other also includes several smaller products
and services, as well as corporate overhead.
In the Guarantor Servicing operating segment, the Company provides a full complement of administrative
services to FFELP guarantors including guarantee issuance, account maintenance, and guarantee fulfillment. In
the Loan Servicing operating segment, the Company provides a full complement of activities required to
service student loans on behalf of lenders who are unrelated to the Company. Such servicing activities
generally commence once a loan has been fully disbursed and include sending out payment coupons to
borrowers, processing borrower payments, originating and disbursing FFELP Consolidation Loans on behalf of
the lender, and other administrative activities required by ED.
Upromise markets and administers saving-for-college plans and also provides administration services for
college savings plans. The Company’s other products and services include comprehensive financing and loan
delivery solutions that it provides to college financial aid offices and students to streamline the financial aid
process. Corporate overhead includes all of the typical headquarter functions such as executive management,
accounting and finance, human resources and marketing.
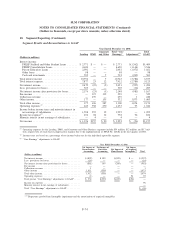
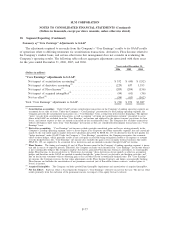
Measure of Profitability
The tables below include the condensed operating results for each of the Company’s reportable segments.
Management, including the chief operating decision maker, evaluates the Company on certain performance
measures that the Company refers to as “Core Earnings” performance measures for each operating segment.
While “Core Earnings” results are not a substitute for reported results under GAAP, the Company relies on
“Core Earnings” performance measures to manage each operating segment because it believes these measures
provide additional information regarding the operational and performance indicators that are most closely
assessed by management.
“Core Earnings” performance measures are the primary financial performance measures used by manage-
ment to develop the Company’s financial plans, track results, and establish corporate performance targets and
incentive compensation. Management believes this information provides additional insight into the financial
performance of the core business activities of its operating segments. Accordingly, the tables presented below
reflect “Core Earnings” operating measures reviewed and utilized by management to manage the business.
Reconciliation of the “Core Earnings” segment totals to the Company’s consolidated operating results in
accordance with GAAP is also included in the tables below.
F-73
SLM CORPORATION
NOTES TO CONSOLIDATED FINANCIAL STATEMENTS (Continued)
(Dollars in thousands, except per share amounts, unless otherwise stated)