Sallie Mae 2006 Annual Report Download - page 75
Download and view the complete annual report
Please find page 75 of the 2006 Sallie Mae annual report below. You can navigate through the pages in the report by either clicking on the pages listed below, or by using the keyword search tool below to find specific information within the annual report.-
 1
1 -
2
-
3
-
4
-
5
-
6
-
7
-
8
-
9
-
10
-
11
-
12
-
13
-
14
-
15
-
16
-
17
-
18
-
19
-
20
-
21
-
22
-
23
-
24
-
25
-
26
-
27
-
28
-
29
-
30
-
31
-
32
-
33
-
34
-
35
-
36
-
37
-
38
-
39
-
40
-
41
-
42
-
43
-
44
-
45
-
46
-
47
-
48
-
49
-
50
-
51
-
52
-
53
-
54
-
55
-
56
-
57
-
58
-
59
-
60
-
61
-
62
-
63
-
64
-
 65
65 -
 66
66 -
 67
67 -
 68
68 -
 69
69 -
 70
70 -
 71
71 -
 72
72 -
 73
73 -
 74
74 -
 75
75 -
 76
76 -
 77
77 -
 78
78 -
 79
79 -
 80
80 -
 81
81 -
 82
82 -
 83
83 -
 84
84 -
 85
85 -
86
-
87
-
88
-
89
-
90
-
91
-
92
-
93
-
94
-
95
-
96
-
97
-
98
-
99
-
100
-
101
-
102
-
103
-
104
-
105
-
106
-
107
-
108
-
109
-
110
-
111
-
112
-
113
-
114
-
115
-
116
-
117
-
118
-
119
-
120
-
121
-
122
-
123
-
124
-
125
-
126
-
127
-
128
-
129
-
130
-
131
-
132
-
133
-
134
-
135
-
136
-
137
-
138
-
139
-
140
-
141
-
142
-
143
-
144
-
145
-
146
-
147
-
148
-
149
-
150
-
151
-
152
-
153
-
154
-
155
-
156
-
157
-
158
-
159
-
160
-
161
-
162
-
163
-
164
-
165
-
166
-
167
-
168
-
169
-
170
-
171
-
172
-
173
-
174
-
175
-
176
-
177
-
178
-
179
-
180
-
181
-
182
-
183
-
184
-
185
-
186
-
187
-
188
-
189
-
190
-
191
-
192
-
193
-
194
-
195
-
196
-
197
-
198
-
199
-
200
-
201
-
202
-
203
-
204
-
205
-
206
-
207
-
208
-
209
-
210
-
211
-
212
-
213
-
214
-
215
 |
 |
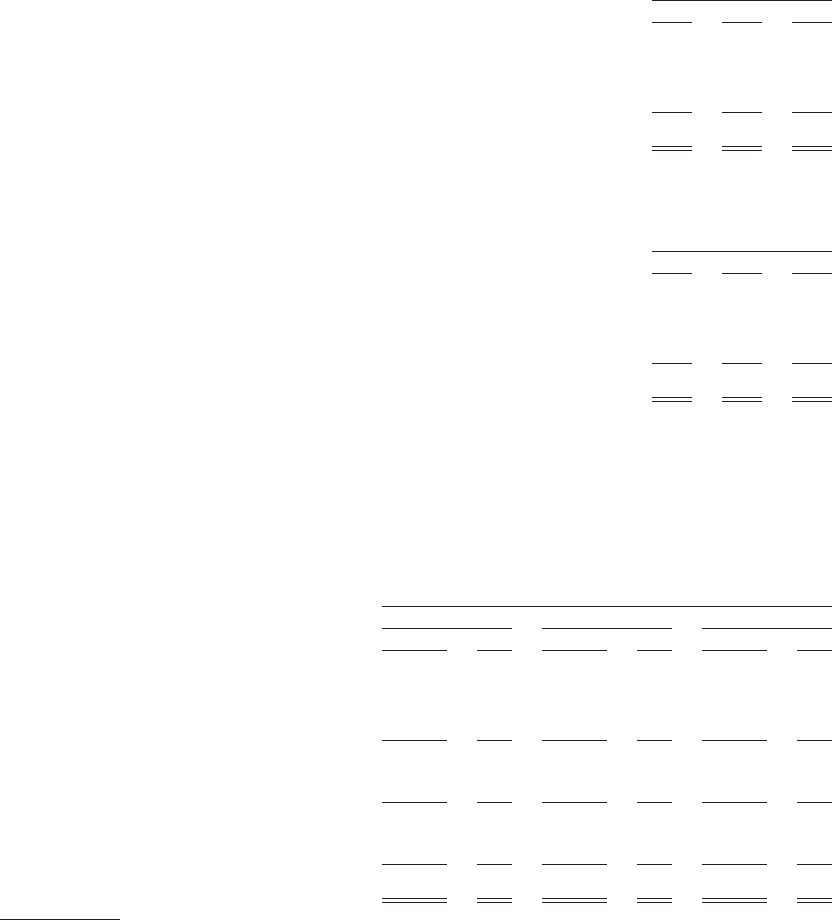
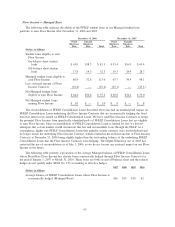
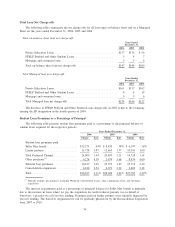
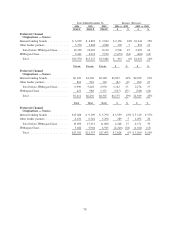
Total Loan Net Charge-offs
The following tables summarize the net charge-offs for all loan types on-balance sheet and on a Managed
Basis for the years ended December 31, 2006, 2005 and 2004.
Total on-balance sheet loan net charge-offs
2006 2005 2004
Years Ended
December 31,
Private Education Loans ....................................... $137 $135 $ 96
FFELP Stafford and Other Student Loans........................... 5 4 7
Mortgage and consumer loans ................................... 5 5 6
Total on-balance sheet loan net charge-offs ......................... $147 $144 $109
Total Managed loan net charge-offs
2006 2005 2004
Years Ended
December 31,
Private Education Loans ....................................... $161 $137 $102
FFELP Stafford and Other Student Loans........................... 8 4 19
Mortgage and consumer loans ................................... 5 5 6
Total Managed loan net charge-offs ............................... $174 $146 $127
The decrease in FFELP Stafford and Other Student Loans charge-offs in 2005 is due to the Company
earning the EP designation in the fourth quarter of 2004.
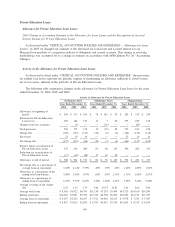
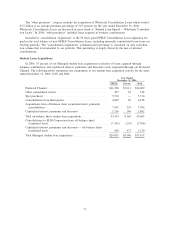
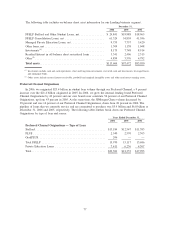
Student Loan Premiums as a Percentage of Principal
The following table presents student loan premiums paid as a percentage of the principal balance of
student loans acquired for the respective periods.
Volume Rate Volume Rate Volume Rate
2006 2005 2004
Years Ended December 31,
Student loan premiums paid:
Sallie Mae brands ................... $12,271 .94% $ 8,430 .38% $ 6,197 .36%
Lender partners ..................... 11,738 1.97 12,463 1.77 10,541 1.60
Total Preferred Channel ............... 24,009 1.44 20,893 1.21 16,738 1.14
Other purchases
(1)
................... 6,228 4.39 2,479 3.68 8,436 4.60
Subtotal base purchases ............... 30,237 2.05 23,372 1.47 25,174 2.30
Consolidation originations ............. 4,188 2.54 4,672 2.32 2,609 2.18
Total ............................. $34,425 2.11% $28,044 1.61% $27,783 2.29%
(1)
Primarily includes spot purchases (including Wholesale Consolidation Loans), other commitment clients, and subsidiary
acquisitions.
The increase in premiums paid as a percentage of principal balance for Sallie Mae brands is primarily
due to the increase in loans where we pay the origination fee and/or federal guaranty fee on behalf of
borrowers, a practice we call zero-fee lending. Premiums paid on lender partners were similarly impacted by
zero-fee lending. The borrower origination fee will be gradually phased out by the Reconciliation Legislation
from 2007 to 2010.
74