Sallie Mae 2006 Annual Report Download - page 68
Download and view the complete annual report
Please find page 68 of the 2006 Sallie Mae annual report below. You can navigate through the pages in the report by either clicking on the pages listed below, or by using the keyword search tool below to find specific information within the annual report.-
 1
1 -
2
-
3
-
4
-
5
-
6
-
7
-
8
-
9
-
10
-
11
-
12
-
13
-
14
-
15
-
16
-
17
-
18
-
19
-
20
-
21
-
22
-
23
-
24
-
25
-
26
-
27
-
28
-
29
-
30
-
31
-
32
-
33
-
34
-
35
-
36
-
37
-
38
-
39
-
40
-
41
-
42
-
43
-
44
-
45
-
46
-
47
-
48
-
49
-
50
-
51
-
52
-
53
-
54
-
55
-
56
-
57
-
 58
58 -
 59
59 -
 60
60 -
 61
61 -
 62
62 -
 63
63 -
 64
64 -
 65
65 -
 66
66 -
 67
67 -
 68
68 -
 69
69 -
 70
70 -
 71
71 -
 72
72 -
 73
73 -
 74
74 -
 75
75 -
 76
76 -
 77
77 -
 78
78 -
79
-
80
-
81
-
82
-
83
-
84
-
85
-
86
-
87
-
88
-
89
-
90
-
91
-
92
-
93
-
94
-
95
-
96
-
97
-
98
-
99
-
100
-
101
-
102
-
103
-
104
-
105
-
106
-
107
-
108
-
109
-
110
-
111
-
112
-
113
-
114
-
115
-
116
-
117
-
118
-
119
-
120
-
121
-
122
-
123
-
124
-
125
-
126
-
127
-
128
-
129
-
130
-
131
-
132
-
133
-
134
-
135
-
136
-
137
-
138
-
139
-
140
-
141
-
142
-
143
-
144
-
145
-
146
-
147
-
148
-
149
-
150
-
151
-
152
-
153
-
154
-
155
-
156
-
157
-
158
-
159
-
160
-
161
-
162
-
163
-
164
-
165
-
166
-
167
-
168
-
169
-
170
-
171
-
172
-
173
-
174
-
175
-
176
-
177
-
178
-
179
-
180
-
181
-
182
-
183
-
184
-
185
-
186
-
187
-
188
-
189
-
190
-
191
-
192
-
193
-
194
-
195
-
196
-
197
-
198
-
199
-
200
-
201
-
202
-
203
-
204
-
205
-
206
-
207
-
208
-
209
-
210
-
211
-
212
-
213
-
214
-
215
 |
 |
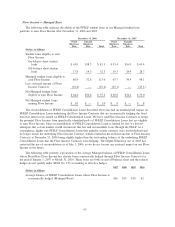
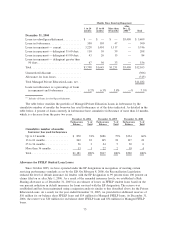
On-Balance Sheet versus Managed Presentation
All Private Education Loans are initially acquired on-balance sheet. When we securitize Private Education
Loans, we no longer legally own the loans and they are accounted for off-balance sheet. For our Managed
presentation in the table above, when loans are securitized, we reduce the on-balance sheet allowance for
amounts previously provided and then provide for these loans off-balance sheet with the total of both on and
off-balance sheet being the Managed allowance.
When Private Education Loans in our securitized trusts settling before September 30, 2005, become
180 days delinquent, we typically exercise our contingent call option to repurchase these loans at par value out
of the trust and record a loss for the difference in the par value paid and the fair market value of the loan at
the time of purchase. If these loans reach the 212-day delinquency, a charge-off for the remaining balance of
the loan is triggered. On a Managed Basis, the losses recorded under GAAP for loans repurchased at day 180
are reversed and the full amount is charged-off at day 212. We do not hold the contingent call option for all
trusts settled after September 30, 2005.
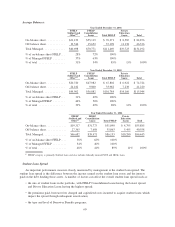
When measured as a percentage of ending loans in repayment, the off-balance sheet allowance is lower
than the on-balance sheet percentage because of the different mix of loans on-balance sheet and off-balance
sheet, as described above. Additionally, a larger percentage of the off-balance sheet loan borrowers are still in-
school status and not required to make payments on their loans. Once repayment begins, the allowance
requirements increase to reflect the increased risk of loss as loans enter repayment.
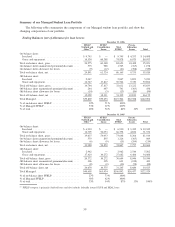
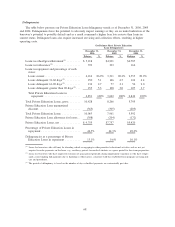
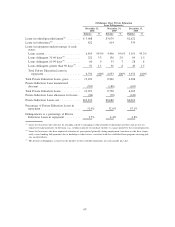
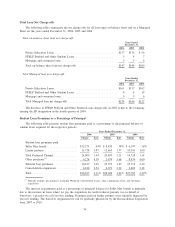
Managed Basis Private Education Loan Loss Allowance Discussion
The allowance for Private Education Loan losses at December 31, 2006 grew 40 percent versus 2005,
which was in direct proportion to the 40 percent growth in the balance of loans in repayment, while net
charge-offs increased 18 percent year-over-year. This resulted in an improvement in the ratio of net charge-
offs to average loans in repayment from 1.89 percent at December 31, 2005 to 1.62 percent at December 31,
2006. The ending balance of the allowance for Private Education Loans at December 31, 2006 resulted in an
average coverage of annual net charge-offs ratio of 2.44, which is an 18 percent increase over the
December 31, 2005 ratio of 2.06.
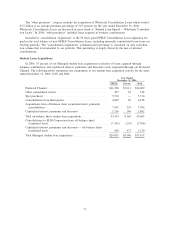
The seasoning and the changing mix of loans in the portfolio, coupled with the higher repayment levels
associated with the growth in our Private Education Loan portfolio have more recently resulted in higher levels
of charge-offs and provision. We expect these levels to continue and likely to increase.
The year-over-year allowance on a Managed Basis increased by $52 million from 2004 to 2005, exclusive
of the adjustments related to the changes in estimate and methodology discussed above. This increase was
primarily driven by the 37 percent year-over-year increase in average loans in repayment. As a result of the
change in the loan loss and recovery estimates discussed above, the allowance as a percentage of ending loans
in repayment decreased from 5.08 percent to 3.40 percent, and consequently the year-over-year growth rate in
the provision is less than the growth rate in the portfolio.
67