Sallie Mae 2006 Annual Report Download - page 88
Download and view the complete annual report
Please find page 88 of the 2006 Sallie Mae annual report below. You can navigate through the pages in the report by either clicking on the pages listed below, or by using the keyword search tool below to find specific information within the annual report.-
 1
1 -
2
-
3
-
4
-
5
-
6
-
7
-
8
-
9
-
10
-
11
-
12
-
13
-
14
-
15
-
16
-
17
-
18
-
19
-
20
-
21
-
22
-
23
-
24
-
25
-
26
-
27
-
28
-
29
-
30
-
31
-
32
-
33
-
34
-
35
-
36
-
37
-
38
-
39
-
40
-
41
-
42
-
43
-
44
-
45
-
46
-
47
-
48
-
49
-
50
-
51
-
52
-
53
-
54
-
55
-
56
-
57
-
58
-
59
-
60
-
61
-
62
-
63
-
64
-
65
-
66
-
67
-
68
-
69
-
70
-
71
-
72
-
73
-
74
-
75
-
76
-
77
-
 78
78 -
 79
79 -
 80
80 -
 81
81 -
 82
82 -
 83
83 -
 84
84 -
 85
85 -
 86
86 -
 87
87 -
 88
88 -
 89
89 -
 90
90 -
 91
91 -
 92
92 -
 93
93 -
 94
94 -
 95
95 -
 96
96 -
 97
97 -
 98
98 -
99
-
100
-
101
-
102
-
103
-
104
-
105
-
106
-
107
-
108
-
109
-
110
-
111
-
112
-
113
-
114
-
115
-
116
-
117
-
118
-
119
-
120
-
121
-
122
-
123
-
124
-
125
-
126
-
127
-
128
-
129
-
130
-
131
-
132
-
133
-
134
-
135
-
136
-
137
-
138
-
139
-
140
-
141
-
142
-
143
-
144
-
145
-
146
-
147
-
148
-
149
-
150
-
151
-
152
-
153
-
154
-
155
-
156
-
157
-
158
-
159
-
160
-
161
-
162
-
163
-
164
-
165
-
166
-
167
-
168
-
169
-
170
-
171
-
172
-
173
-
174
-
175
-
176
-
177
-
178
-
179
-
180
-
181
-
182
-
183
-
184
-
185
-
186
-
187
-
188
-
189
-
190
-
191
-
192
-
193
-
194
-
195
-
196
-
197
-
198
-
199
-
200
-
201
-
202
-
203
-
204
-
205
-
206
-
207
-
208
-
209
-
210
-
211
-
212
-
213
-
214
-
215
 |
 |

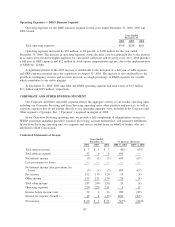
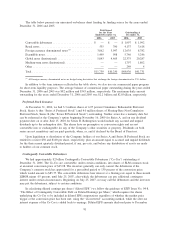
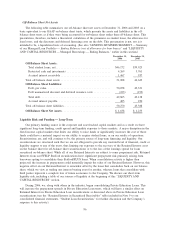
Operating Expenses — DMO Business Segment
Operating expenses for the DMO business segment for the years ended December 31, 2006, 2005 and
2004 totaled:
2006 2005 2004
Years Ended
December 31,
Total operating expenses ....................................... $358 $288 $161
Operating expenses increased by $70 million, or 24 percent, to $358 million for the year ended
December 31, 2006. The increase in operating expenses versus the prior year was primarily due to the increase
in accounts serviced and to higher expenses for outsourced collections and recovery costs. Also, 2006 includes
a full year of GRP expenses and $12 million of stock option compensation expense, due to the implementation
of SFAS No. 123(R).
A significant portion of the 2005 increase is attributable to the inclusion of a full year of AFS expenses
and GRP expenses incurred since the acquisition on August 31, 2005. The increase is also attributable to the
growth in contingency revenue and accounts serviced, as a high percentage of DMO expenses are variable
which contributes to our stable margins.
At December 31, 2006, 2005 and 2004, the DMO operating segment had total assets of $1.5 billion,
$1.1 billion and $519 million, respectively.
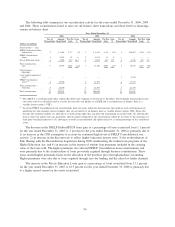
CORPORATE AND OTHER BUSINESS SEGMENT
Our Corporate and Other reportable segment reflects the aggregate activity of our smaller operating units
including our Guarantor Servicing and Loan Servicing operating units, other products and services, as well as
corporate expenses that do not pertain directly to our operating segments. Also, included in the Corporate and
Other segment is Upromise, Inc. (“Upromise”), acquired in August of 2006.
In our Guarantor Servicing operating unit, we provide a full complement of administrative services to
FFELP guarantors including guarantee issuance, processing, account maintenance, and guarantee fulfillment.
In our Loan Servicing operating unit, we originate and service student loans on behalf of lenders who are
unrelated to SLM Corporation.
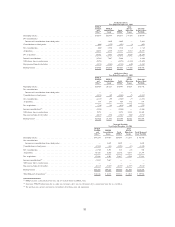
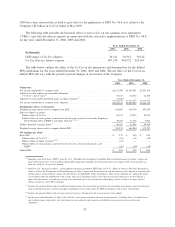
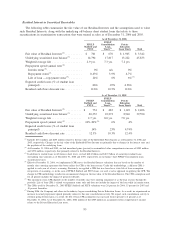
Condensed Statements of Income
2006 2005 2004 2006 vs. 2005 2005 vs. 2004
Years Ended
December 31, % Increase (Decrease)
Total interest income ................... $ 7 $ 5 $ 3 40% 67%
Total interest expense ................... 12 6 6 100 —
Net interest income ..................... (5) (1) (3) 400 (67)
Less provisions for losses ................ — — — — —
Net interest income after provisions for
losses ............................. (5) (1) (3) 400 (67)
Fee income........................... 132 115 120 15 (4)
Other income ......................... 155 125 130 24 (4)
Total other income ..................... 287 240 250 20 (4)
Operating expenses ..................... 250 235 211 6 11
Income before income taxes .............. 32 4 36 700 (89)
Income tax expense (benefit) .............. 12 1 (15) 1100 (107)
Net income........................... $ 20 $ 3 $ 51 567% (94)%
87