SunTrust 2012 Annual Report Download - page 97
Download and view the complete annual report
Please find page 97 of the 2012 SunTrust annual report below. You can navigate through the pages in the report by either clicking on the pages listed below, or by using the keyword search tool below to find specific information within the annual report.-
 1
1 -
2
-
3
-
4
-
5
-
6
-
7
-
8
-
9
-
10
-
11
-
12
-
13
-
14
-
15
-
16
-
17
-
18
-
19
-
20
-
21
-
22
-
23
-
24
-
25
-
26
-
27
-
28
-
29
-
30
-
31
-
32
-
33
-
34
-
35
-
36
-
37
-
38
-
39
-
40
-
41
-
42
-
43
-
44
-
45
-
46
-
47
-
48
-
49
-
50
-
51
-
52
-
53
-
54
-
55
-
56
-
57
-
58
-
59
-
60
-
61
-
62
-
63
-
64
-
65
-
66
-
67
-
68
-
69
-
70
-
71
-
72
-
73
-
74
-
75
-
76
-
77
-
78
-
79
-
80
-
81
-
82
-
83
-
84
-
85
-
86
-
 87
87 -
 88
88 -
 89
89 -
 90
90 -
 91
91 -
 92
92 -
 93
93 -
 94
94 -
 95
95 -
 96
96 -
 97
97 -
 98
98 -
 99
99 -
 100
100 -
 101
101 -
 102
102 -
 103
103 -
 104
104 -
 105
105 -
 106
106 -
 107
107 -
108
-
109
-
110
-
111
-
112
-
113
-
114
-
115
-
116
-
117
-
118
-
119
-
120
-
121
-
122
-
123
-
124
-
125
-
126
-
127
-
128
-
129
-
130
-
131
-
132
-
133
-
134
-
135
-
136
-
137
-
138
-
139
-
140
-
141
-
142
-
143
-
144
-
145
-
146
-
147
-
148
-
149
-
150
-
151
-
152
-
153
-
154
-
155
-
156
-
157
-
158
-
159
-
160
-
161
-
162
-
163
-
164
-
165
-
166
-
167
-
168
-
169
-
170
-
171
-
172
-
173
-
174
-
175
-
176
-
177
-
178
-
179
-
180
-
181
-
182
-
183
-
184
-
185
-
186
-
187
-
188
-
189
-
190
-
191
-
192
-
193
-
194
-
195
-
196
-
197
-
198
-
199
-
200
-
201
-
202
-
203
-
204
-
205
-
206
-
207
-
208
-
209
-
210
-
211
-
212
-
213
-
214
-
215
-
216
-
217
-
218
-
219
-
220
-
221
-
222
-
223
-
224
-
225
-
226
-
227
-
228
 |
 |

81
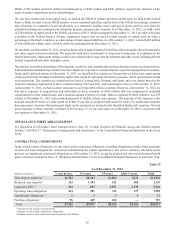
simulation and valuation analyses do not include actions that management may undertake to manage this risk in response to
anticipated changes in interest rates.
Market Risk from Trading Activities
Under established policies and procedures, we manage market risk associated with trading, capital markets, and foreign
exchange activities using a VAR approach that determines total exposure arising from interest rate risk, equity risk, foreign
exchange risk, spread risk, and volatility risk. For trading portfolios, VAR measures the estimated maximum loss from a
trading position, given a specified confidence level and time horizon. VAR exposures and actual results are monitored daily
for each trading portfolio. Our VAR calculation measures the potential trading losses using a one day holding period at a one-
tail, 99% confidence level. This means that, on average, trading losses are expected to exceed VAR one out of 100 trading
days, or two to three times per year. We had no backtest exceptions to our overall firmwide VAR during the years ended
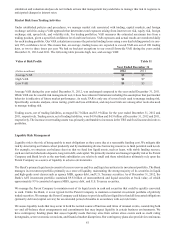
December 31, 2012 and 2011. The following table presents high, low, and average VAR:
Value at Risk Profile Table 31
Year Ended December 31
(Dollars in millions) 2012 2011
Average VAR $5 $5
High VAR $6 $7
Low VAR $4 $3
Average VAR during the year ended December 31, 2012, was unchanged compared to the year ended December 31, 2011.
While VAR can be a useful risk management tool, it does have inherent limitations including the assumption that past market
behavior is indicative of future market performance. As such, VAR is only one of several tools used to manage trading risk.
Specifically, scenario analysis, stress testing, profit and loss attribution, and stop loss limits are among other tools also used
to manage trading risk.
Trading assets, net of trading liabilities, averaged $4.7 billion and $3.9 billion for the year ended December 31, 2012 and
2011, respectively. Trading assets, net of trading liabilities, were $4.9 billion and $4.5 billion at December 31, 2012 and 2011,
respectively. The increase in net trading assets was primarily attributable to increases in the TRS and fixed income derivatives
portfolios.
Liquidity Risk Management
Liquidity risk is the risk of being unable to meet obligations as they come due at a reasonable funding cost. We mitigate this
risk by structuring our balance sheet prudently and by maintaining diverse borrowing resources to fund potential cash needs.
For example, we structure our balance sheet so that we fund less liquid assets, such as loans, with stable funding sources,
such as retail and wholesale deposits, long-term debt, and capital. We primarily monitor and manage liquidity risk at the Parent
Company and Bank levels as the non-bank subsidiaries are relatively small and these subsidiaries ultimately rely upon the
Parent Company as a source of liquidity in adverse environments.
The Bank’s primary liquid assets consist of excess reserves and free and liquid securities in its investment portfolio. The Bank
manages its investment portfolio primarily as a store of liquidity, maintaining the strong majority of its securities in liquid
and high-grade asset classes such as agency MBS, agency debt, and U.S. Treasury securities. As of December 31, 2012, the
Bank’s AFS investment portfolio contained $9.8 billion of unencumbered and liquid securities at book value, of which
approximately 93% consisted of agency MBS, agency debt, and U.S. Treasury securities.
We manage the Parent Company to maintain most of its liquid assets in cash and securities that could be quickly converted
to cash. Unlike the Bank, it is not typical for the Parent Company to maintain a material investment portfolio of publicly
traded securities. We manage the Parent Company cash balance to provide sufficient liquidity to fund all forecasted obligations
(primarily debt and capital service) for an extended period of months in accordance with our risk limits.
We assess liquidity needs that may occur in both the normal course of business and times of unusual events, considering both
on- and off-balance sheet arrangements and commitments that may impact liquidity in certain business environments. We
have contingency funding plans that assess liquidity needs that may arise from certain stress events such as credit rating
downgrades, severe economic recessions, and financial market disruptions. Our contingency plans also provide for continuous