SunTrust 2012 Annual Report Download - page 133
Download and view the complete annual report
Please find page 133 of the 2012 SunTrust annual report below. You can navigate through the pages in the report by either clicking on the pages listed below, or by using the keyword search tool below to find specific information within the annual report.-
 1
1 -
2
-
3
-
4
-
5
-
6
-
7
-
8
-
9
-
10
-
11
-
12
-
13
-
14
-
15
-
16
-
17
-
18
-
19
-
20
-
21
-
22
-
23
-
24
-
25
-
26
-
27
-
28
-
29
-
30
-
31
-
32
-
33
-
34
-
35
-
36
-
37
-
38
-
39
-
40
-
41
-
42
-
43
-
44
-
45
-
46
-
47
-
48
-
49
-
50
-
51
-
52
-
53
-
54
-
55
-
56
-
57
-
58
-
59
-
60
-
61
-
62
-
63
-
64
-
65
-
66
-
67
-
68
-
69
-
70
-
71
-
72
-
73
-
74
-
75
-
76
-
77
-
78
-
79
-
80
-
81
-
82
-
83
-
84
-
85
-
86
-
87
-
88
-
89
-
90
-
91
-
92
-
93
-
94
-
95
-
96
-
97
-
98
-
99
-
100
-
101
-
102
-
103
-
104
-
105
-
106
-
107
-
108
-
109
-
110
-
111
-
112
-
113
-
114
-
115
-
116
-
117
-
118
-
119
-
120
-
121
-
122
-
 123
123 -
 124
124 -
 125
125 -
 126
126 -
 127
127 -
 128
128 -
 129
129 -
 130
130 -
 131
131 -
 132
132 -
 133
133 -
 134
134 -
 135
135 -
 136
136 -
 137
137 -
 138
138 -
 139
139 -
 140
140 -
 141
141 -
 142
142 -
 143
143 -
144
-
145
-
146
-
147
-
148
-
149
-
150
-
151
-
152
-
153
-
154
-
155
-
156
-
157
-
158
-
159
-
160
-
161
-
162
-
163
-
164
-
165
-
166
-
167
-
168
-
169
-
170
-
171
-
172
-
173
-
174
-
175
-
176
-
177
-
178
-
179
-
180
-
181
-
182
-
183
-
184
-
185
-
186
-
187
-
188
-
189
-
190
-
191
-
192
-
193
-
194
-
195
-
196
-
197
-
198
-
199
-
200
-
201
-
202
-
203
-
204
-
205
-
206
-
207
-
208
-
209
-
210
-
211
-
212
-
213
-
214
-
215
-
216
-
217
-
218
-
219
-
220
-
221
-
222
-
223
-
224
-
225
-
226
-
227
-
228
 |
 |

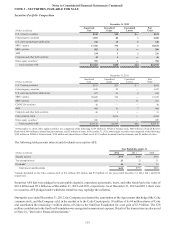
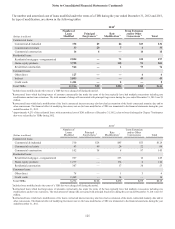
Notes to Consolidated Financial Statements (Continued)
117
December 31, 2011
Less than twelve months Twelve months or longer Total
(Dollars in millions)
Fair
Value
Unrealized
Losses
Fair
Value
Unrealized
Losses
Fair
Value
Unrealized
Losses
Temporarily impaired securities:
Federal agency securities $10 $— $— $— $10 $—
U.S. states and political subdivisions 1 — 28 4 29 4
MBS - agency 224 — 1 — 225 —
CDO/CLO securities 50 — — — 50 —
ABS — — 11 5 11 5
Total temporarily impaired securities 285 — 40 9 325 9
OTTI securities1:
MBS - private 15 1 206 30 221 31
ABS 1 — 3 2 4 2
Total OTTI securities 16 1 209 32 225 33
Total impaired securities $301 $1 $249 $41 $550 $42
1Includes OTTI securities for which credit losses have been recorded in earnings in current or prior periods.
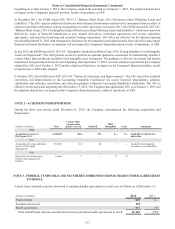
At December 31, 2012 and 2011, unrealized losses on securities that have been in a temporarily impaired position for longer
than twelve months included municipal ARS and one ABS collateralized by 2004 vintage home equity loans. The municipal
securities are backed by investment grade rated obligors; however, the fair value of these securities continues to be impacted
by the lack of a functioning ARS market and the extension of time for expected refinance and repayment. No credit loss is
expected on these securities. The ABS also continues to receive timely principal and interest payments, and is evaluated
quarterly for credit impairment. Cash flow analysis shows that the underlying collateral can withstand highly stressed loss
assumptions without incurring a credit loss.
The portion of unrealized losses on securities that have been other-than-temporarily impaired that relates to factors other than
credit are recorded in AOCI. Losses related to credit impairment on these securities is determined through estimated cash flow
analyses and have been recorded in earnings in current or prior periods. The unrealized OTTI loss relating to ABS at
December 31, 2012 is related to two securities within the portfolios that are 2004 vintage home equity issuances. The
expectation of cash flows for the previously impaired ABS securities has improved since the credit-related impairment was
recognized, and as a result, the amount of expected credit losses was reduced, and the expected increase in cash flows is being
accreted into earnings as a yield adjustment over the remaining life of the securities.
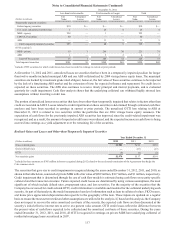
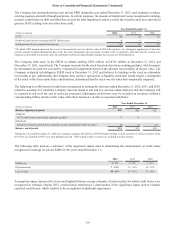
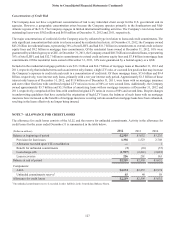
Realized Gains and Losses and Other-than-Temporarily Impaired Securities
Year Ended December 31
(Dollars in millions) 2012 2011 2010
Gross realized gains $1,981 1$210 $210
Gross realized losses —(87) (17)
OTTI (7) (6) (2)
Net securities gains $1,974 $117 $191
1Included in these amounts are $305 million in losses recognized during 2012 related to the accelerated termination of the Agreements that hedge the
Coke common stock.
The securities that gave rise to credit impairments recognized during the years ended December 31, 2012, 2011, and 2010, as
shown in the table below, consisted of private MBS with a fair value of $209 million, $167 million, and $1 million, respectively.
Credit impairment that is determined through the use of cash flow models is estimated using cash flows on security specific
collateral and the transaction structure. Future expected credit losses are determined by using various assumptions, the most
significant of which include default rates, prepayment rates, and loss severities. For the majority of the securities that the
Company has reviewed for credit-related OTTI, credit information is available and modeled for the collateral underlying each
security. As part of that analysis, the model incorporates loan level information such as loan to collateral values, FICO scores,
and home price appreciation/depreciation data specific to the geography of the loan. These inputs are updated on a regular
basis to ensure the most current credit and other assumptions are utilized in the analysis. If, based on this analysis, the Company
does not expect to recover the entire amortized cost basis of the security, the expected cash flows are then discounted at the
security’s initial effective interest rate to arrive at a present value amount. OTTI credit losses reflect the difference between
the present value of cash flows expected to be collected and the amortized cost basis of these securities. During the years
ended December 31, 2012, 2011, and 2010, all OTTI recognized in earnings on private MBS have underlying collateral of
residential mortgage loans securitized in 2007.