SunTrust 2012 Annual Report Download - page 87
Download and view the complete annual report
Please find page 87 of the 2012 SunTrust annual report below. You can navigate through the pages in the report by either clicking on the pages listed below, or by using the keyword search tool below to find specific information within the annual report.-
 1
1 -
2
-
3
-
4
-
5
-
6
-
7
-
8
-
9
-
10
-
11
-
12
-
13
-
14
-
15
-
16
-
17
-
18
-
19
-
20
-
21
-
22
-
23
-
24
-
25
-
26
-
27
-
28
-
29
-
30
-
31
-
32
-
33
-
34
-
35
-
36
-
37
-
38
-
39
-
40
-
41
-
42
-
43
-
44
-
45
-
46
-
47
-
48
-
49
-
50
-
51
-
52
-
53
-
54
-
55
-
56
-
57
-
58
-
59
-
60
-
61
-
62
-
63
-
64
-
65
-
66
-
67
-
68
-
69
-
70
-
71
-
72
-
73
-
74
-
75
-
76
-
 77
77 -
 78
78 -
 79
79 -
 80
80 -
 81
81 -
 82
82 -
 83
83 -
 84
84 -
 85
85 -
 86
86 -
 87
87 -
 88
88 -
 89
89 -
 90
90 -
 91
91 -
 92
92 -
 93
93 -
 94
94 -
 95
95 -
 96
96 -
 97
97 -
98
-
99
-
100
-
101
-
102
-
103
-
104
-
105
-
106
-
107
-
108
-
109
-
110
-
111
-
112
-
113
-
114
-
115
-
116
-
117
-
118
-
119
-
120
-
121
-
122
-
123
-
124
-
125
-
126
-
127
-
128
-
129
-
130
-
131
-
132
-
133
-
134
-
135
-
136
-
137
-
138
-
139
-
140
-
141
-
142
-
143
-
144
-
145
-
146
-
147
-
148
-
149
-
150
-
151
-
152
-
153
-
154
-
155
-
156
-
157
-
158
-
159
-
160
-
161
-
162
-
163
-
164
-
165
-
166
-
167
-
168
-
169
-
170
-
171
-
172
-
173
-
174
-
175
-
176
-
177
-
178
-
179
-
180
-
181
-
182
-
183
-
184
-
185
-
186
-
187
-
188
-
189
-
190
-
191
-
192
-
193
-
194
-
195
-
196
-
197
-
198
-
199
-
200
-
201
-
202
-
203
-
204
-
205
-
206
-
207
-
208
-
209
-
210
-
211
-
212
-
213
-
214
-
215
-
216
-
217
-
218
-
219
-
220
-
221
-
222
-
223
-
224
-
225
-
226
-
227
-
228
 |
 |
71
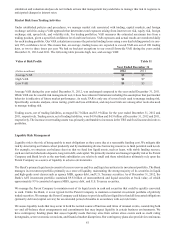
markets and also hold a limited amount of instruments that do not have an active market, which creates additional challenges
when estimating the fair value of these financial instruments.
Generally, the assets and liabilities most affected by the lack of liquidity or observable market are those required to be classified
as level 3 in the fair value hierarchy. As a result, various processes and controls have been adopted to determine that appropriate
methodologies, techniques and assumptions are used in the development of fair value estimates, particularly related to those
instruments that require the use of significant, unobservable inputs. We continue to maintain a cross-functional approach when
estimating the fair value of these difficult to value financial instruments. This includes input from not only the related line of
business, but also from risk management and finance, to ultimately arrive at a consensus estimate of the instrument's fair value
after evaluating all available information pertaining to fair value. This process involves the gathering of multiple sources of
information, including broker quotes, values provided by pricing services, trading activity in other similar instruments, market
indices, and pricing matrices along with employing various modeling techniques, such as discounted cash flow analyses, in
arriving at the best estimate of fair value. Modeling techniques incorporate our assessments regarding assumptions that market
participants would use in pricing the asset or the liability, including market-based assumptions, such as interest rates, as well
as assumptions about the risks inherent in a particular valuation technique, the effect of a restriction on the sale or use of an
asset, market liquidity, and the risk of nonperformance. In certain cases, our assessments with respect to assumptions that
market participants would make may be inherently difficult to determine, and the use of different assumptions could result
in material changes to these fair value measurements. We used significant unobservable inputs to fair value, on a recurring
basis, for certain trading assets, securities AFS, portfolio loans accounted for at fair value, IRLCs, LHFS, MSRs, and certain
derivatives. Overall, the financial impact of the level 3 financial instruments did not have a material impact on our liquidity
or capital. Our exposure to level 3 financial instruments continues to decline due to paydowns, sales and settlements of these
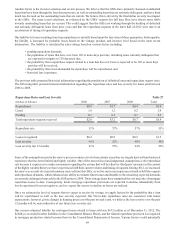
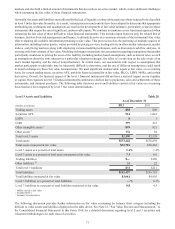
instruments, and minimal purchases. The following table discloses assets and liabilities carried at fair value on a recurring
basis that have been impacted by level 3 fair value determinations.
Level 3 Assets and Liabilities Table 28
As of December 31
(Dollars in millions) 2012 2011
Trading assets $58 $49
Securities AFS 914 1,041
LHFS 81
LHFI 379 433
Other intangible assets 1899 921
Other assets 2132 84
Total level 3 assets $2,390 $2,529
Total assets $173,442 $176,859
Total assets measured at fair value $32,701 $38,445
Level 3 assets as a percent of total assets 1.4% 1.4%
Level 3 assets as a percent of total assets measured at fair value 7.3 6.6
Trading liabilities $— $189
Other liabilities 2,3 31 22
Total level 3 liabilities $31 $211
Total liabilities $152,457 $156,793
Total liabilities measured at fair value $3,661 $4,905
Level 3 liabilities as a percent of total liabilities —% 0.1%
Level 3 liabilities as a percent of total liabilities measured at fair value 0.8 4.3
1 MSRs carried at fair value
2 Includes IRLCs
3 Includes Visa derivative
The following discussion provides further information on fair value accounting by balance sheet category including the
difficult to value assets and liabilities displayed in the table above. See Note 18, “Fair Value Election and Measurement,” to
the Consolidated Financial Statements in this Form 10-K for a detailed discussion regarding level 2 and 3 securities and
valuation methodologies for each class of securities.