SunTrust 2012 Annual Report Download - page 84
Download and view the complete annual report
Please find page 84 of the 2012 SunTrust annual report below. You can navigate through the pages in the report by either clicking on the pages listed below, or by using the keyword search tool below to find specific information within the annual report.-
 1
1 -
2
-
3
-
4
-
5
-
6
-
7
-
8
-
9
-
10
-
11
-
12
-
13
-
14
-
15
-
16
-
17
-
18
-
19
-
20
-
21
-
22
-
23
-
24
-
25
-
26
-
27
-
28
-
29
-
30
-
31
-
32
-
33
-
34
-
35
-
36
-
37
-
38
-
39
-
40
-
41
-
42
-
43
-
44
-
45
-
46
-
47
-
48
-
49
-
50
-
51
-
52
-
53
-
54
-
55
-
56
-
57
-
58
-
59
-
60
-
61
-
62
-
63
-
64
-
65
-
66
-
67
-
68
-
69
-
70
-
71
-
72
-
73
-
 74
74 -
 75
75 -
 76
76 -
 77
77 -
 78
78 -
 79
79 -
 80
80 -
 81
81 -
 82
82 -
 83
83 -
 84
84 -
 85
85 -
 86
86 -
 87
87 -
 88
88 -
 89
89 -
 90
90 -
 91
91 -
 92
92 -
 93
93 -
 94
94 -
95
-
96
-
97
-
98
-
99
-
100
-
101
-
102
-
103
-
104
-
105
-
106
-
107
-
108
-
109
-
110
-
111
-
112
-
113
-
114
-
115
-
116
-
117
-
118
-
119
-
120
-
121
-
122
-
123
-
124
-
125
-
126
-
127
-
128
-
129
-
130
-
131
-
132
-
133
-
134
-
135
-
136
-
137
-
138
-
139
-
140
-
141
-
142
-
143
-
144
-
145
-
146
-
147
-
148
-
149
-
150
-
151
-
152
-
153
-
154
-
155
-
156
-
157
-
158
-
159
-
160
-
161
-
162
-
163
-
164
-
165
-
166
-
167
-
168
-
169
-
170
-
171
-
172
-
173
-
174
-
175
-
176
-
177
-
178
-
179
-
180
-
181
-
182
-
183
-
184
-
185
-
186
-
187
-
188
-
189
-
190
-
191
-
192
-
193
-
194
-
195
-
196
-
197
-
198
-
199
-
200
-
201
-
202
-
203
-
204
-
205
-
206
-
207
-
208
-
209
-
210
-
211
-
212
-
213
-
214
-
215
-
216
-
217
-
218
-
219
-
220
-
221
-
222
-
223
-
224
-
225
-
226
-
227
-
228
 |
 |

68
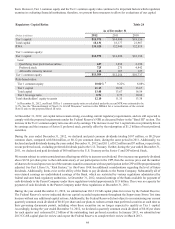
claims and losses related to loans sold since 2009 as a result of stronger credit performance, more stringent credit guidelines,
and underwriting process improvements.
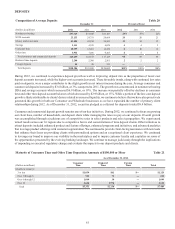
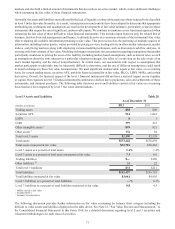
Repurchase requests received since 2005 have totaled $7.1 billion which includes Ginnie Mae repurchase demands. The
following table summarizes demand activity for the years ended December 31:
Repurchase Request Activity Table 25
(Dollars in millions) 2012 2011 2010
Beginning pending repurchase requests $590 $293 $326
Repurchase requests received 1,726 1,736 1,130
Repurchase requests resolved:
Repurchased (769) (789)(677)
Cured (892) (650)(486)
Total resolved (1,661) (1,439)(1,163)
Ending pending repurchase requests $655 $590 $293
Percent from non-agency investors:
Repurchase requests received 1.2% 2.9% 4.9%
Pending repurchase requests 2.5% 2.0% 9.9%
As presented in the table above, repurchase requests were relatively stable in 2012 as compared to 2011, even though the first
half of 2012 reflected a higher pace of repurchase requests. The repurchase request level subsequently moderated in the second
half of 2012. The repurchase requests were primarily related to loans sold to FNMA from 2006 to 2008. The repurchase
requests continue to be concentrated in loans that are seriously delinquent or have already been through the foreclosure process.
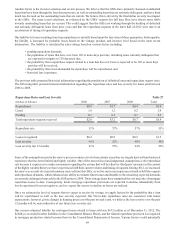
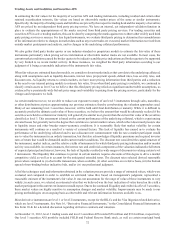
The following table summarizes the original principal balance of loans sold from 2006 to 2008, excluding loans sold to Ginnie
Mae, as well as the cumulative default rate and repurchase request rate:
Original Principal Balance Sold Table 26
(Dollars in billions) 2006 2007 2008 Total
Sold unpaid principal balance
GSEs $30.2 $40.8 $27.6 $98.6
Non-agency 11.9 9.4 0.1 21.4
Total sold unpaid principal balance $42.1 $50.2 $27.7 $120.0
Ever-120 days past due1$7.8 $11.0 $3.0 $21.8
Ever-120 days past due/sold unpaid principal balance 18.5% 21.9% 10.8% 18.1%
Total repurchase requests received $2.0 $3.2 $0.7 $5.9
Total repurchase requests/ever-120 days past due 25.1% 29.5% 25.0% 27.3%
1 Includes estimates for delinquent loans sold servicing released
Repurchase requests received during 2012 were primarily related to loans sold in 2007. The volume of repurchase requests
from a particular sale vintage is driven by several factors. The primary factor is the volume of defaulted loans. As shown
above, the largest volume of defaulted loans is from 2007 due to the volume of sales during that year, combined with the
credit guidelines applicable to loans originated during that period. To date, repurchase request volumes were also driven by
the inverse relationship between repurchase requests and the amount of time between origination and default. That is, the
shorter the timeframe between origination and default, the greater the repurchase request volume; and the longer the timeframe,
the lower the repurchase request volume. Because of this relationship, fewer repurchase requests received during 2012 were
from loans sold prior to 2006.