SunTrust 2012 Annual Report Download - page 96
Download and view the complete annual report
Please find page 96 of the 2012 SunTrust annual report below. You can navigate through the pages in the report by either clicking on the pages listed below, or by using the keyword search tool below to find specific information within the annual report.-
 1
1 -
2
-
3
-
4
-
5
-
6
-
7
-
8
-
9
-
10
-
11
-
12
-
13
-
14
-
15
-
16
-
17
-
18
-
19
-
20
-
21
-
22
-
23
-
24
-
25
-
26
-
27
-
28
-
29
-
30
-
31
-
32
-
33
-
34
-
35
-
36
-
37
-
38
-
39
-
40
-
41
-
42
-
43
-
44
-
45
-
46
-
47
-
48
-
49
-
50
-
51
-
52
-
53
-
54
-
55
-
56
-
57
-
58
-
59
-
60
-
61
-
62
-
63
-
64
-
65
-
66
-
67
-
68
-
69
-
70
-
71
-
72
-
73
-
74
-
75
-
76
-
77
-
78
-
79
-
80
-
81
-
82
-
83
-
84
-
85
-
 86
86 -
 87
87 -
 88
88 -
 89
89 -
 90
90 -
 91
91 -
 92
92 -
 93
93 -
 94
94 -
 95
95 -
 96
96 -
 97
97 -
 98
98 -
 99
99 -
 100
100 -
 101
101 -
 102
102 -
 103
103 -
 104
104 -
 105
105 -
 106
106 -
107
-
108
-
109
-
110
-
111
-
112
-
113
-
114
-
115
-
116
-
117
-
118
-
119
-
120
-
121
-
122
-
123
-
124
-
125
-
126
-
127
-
128
-
129
-
130
-
131
-
132
-
133
-
134
-
135
-
136
-
137
-
138
-
139
-
140
-
141
-
142
-
143
-
144
-
145
-
146
-
147
-
148
-
149
-
150
-
151
-
152
-
153
-
154
-
155
-
156
-
157
-
158
-
159
-
160
-
161
-
162
-
163
-
164
-
165
-
166
-
167
-
168
-
169
-
170
-
171
-
172
-
173
-
174
-
175
-
176
-
177
-
178
-
179
-
180
-
181
-
182
-
183
-
184
-
185
-
186
-
187
-
188
-
189
-
190
-
191
-
192
-
193
-
194
-
195
-
196
-
197
-
198
-
199
-
200
-
201
-
202
-
203
-
204
-
205
-
206
-
207
-
208
-
209
-
210
-
211
-
212
-
213
-
214
-
215
-
216
-
217
-
218
-
219
-
220
-
221
-
222
-
223
-
224
-
225
-
226
-
227
-
228
 |
 |

80
billion as of December 31, 2012 due to maturities and debt repurchases, and as such, the interest rate sensitivity results from
an economic perspective has become materially consistent with our primary interest rate sensitivity results shown below.
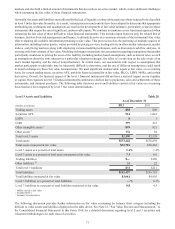
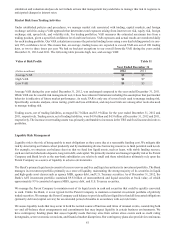
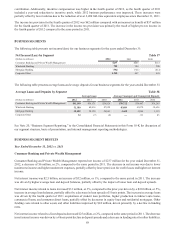
The sensitivity analysis included below is measured as a percentage change in NII due to instantaneous moves in benchmark
interest rates. Traditionally, our analysis of interest rate sensitivity was based on rate changes of +100 and -100 basis points,
however, the -100 basis point analysis is less meaningful due to current interest rate levels that are already at or near 0%. As
a result, we have included a more reasonable downward rate change of -25 basis points and also included an additional upward
rate change of + 200. Estimated changes set forth below are dependent upon material assumptions such as those previously
discussed.
Table 29
Estimated % Change in NII
Over 12 Months
(Basis points) December 31, 2012 December 31, 2011
Rate Change
+200 4.8% 2.8%
+100 2.5% 1.8%
-25 (0.8)% (0.3)%
Asset sensitivity has slightly increased from December 31, 2011 to December 31, 2012 primarily due to projected balance
sheet growth of floating rate assets and fixed rate deposits.
We also perform valuation analysis, which we use for discerning levels of risk present in the balance sheet and derivative
positions that might not be taken into account in the NII simulation analysis above. Whereas NII simulation highlights exposures
over a relatively short time horizon, valuation analysis incorporates all cash flows over the estimated remaining life of all
balance sheet and derivative positions. The valuation of the balance sheet, at a point in time, is defined as the discounted
present value of asset cash flows and derivative cash flows minus the discounted present value of liability cash flows, the net
of which is referred to as MVE. The sensitivity of MVE to changes in the level of interest rates is a measure of the longer-
term repricing risk and options risk embedded in the balance sheet. Similar to the NII simulation, MVE uses instantaneous
changes in rates. However, MVE values only the current balance sheet and does not incorporate the growth assumptions that
are used in the NII simulation model. As with the NII simulation model, assumptions about the timing and variability of
balance sheet cash flows are critical in the MVE analysis. Particularly important are the assumptions driving prepayments
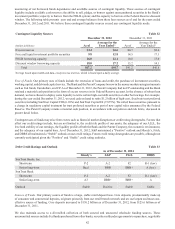
and the expected changes in balances and pricing of the indeterminate deposit portfolios. As of December 31, 2012, the MVE
profile indicates changes due to instantaneous changes in rates. MVE sensitivity is reported in both upward and downward
rate shocks.
Market Value of Equity Sensitivity Table 30
Estimated % Change in MVE
(Basis points) December 31, 2012 December 31, 2011
Rate Change
+200 (2.4)% (7.1)%
+100 (0.1)% (2.4)%
-25 (0.3)% 0.1%
The year over year decrease in MVE sensitivity to higher rates is primarily due to shortening of asset durations in a lower
rate environment which will reverse to some extent in higher rate scenarios. A corresponding increase of NII to higher rates,
as noted above, is due to a greater mix of floating rate assets than liabilities which would reprice to higher yields over the
next year if rates did in fact increase.
While an instantaneous and severe shift in interest rates was used in this analysis to provide an estimate of exposure under
an extremely adverse scenario, we believe that a gradual shift in interest rates would have a much more modest impact. Since
MVE measures the discounted present value of cash flows over the estimated lives of instruments, the change in MVE does
not directly correlate to the degree that earnings would be impacted over a shorter time horizon (i.e., the current year). Further,
MVE does not take into account factors such as future balance sheet growth, changes in product mix, changes in yield curve
relationships, and changing product spreads that could mitigate the adverse impact of changes in interest rates. The NII