SunTrust 2012 Annual Report Download - page 135
Download and view the complete annual report
Please find page 135 of the 2012 SunTrust annual report below. You can navigate through the pages in the report by either clicking on the pages listed below, or by using the keyword search tool below to find specific information within the annual report.-
 1
1 -
2
-
3
-
4
-
5
-
6
-
7
-
8
-
9
-
10
-
11
-
12
-
13
-
14
-
15
-
16
-
17
-
18
-
19
-
20
-
21
-
22
-
23
-
24
-
25
-
26
-
27
-
28
-
29
-
30
-
31
-
32
-
33
-
34
-
35
-
36
-
37
-
38
-
39
-
40
-
41
-
42
-
43
-
44
-
45
-
46
-
47
-
48
-
49
-
50
-
51
-
52
-
53
-
54
-
55
-
56
-
57
-
58
-
59
-
60
-
61
-
62
-
63
-
64
-
65
-
66
-
67
-
68
-
69
-
70
-
71
-
72
-
73
-
74
-
75
-
76
-
77
-
78
-
79
-
80
-
81
-
82
-
83
-
84
-
85
-
86
-
87
-
88
-
89
-
90
-
91
-
92
-
93
-
94
-
95
-
96
-
97
-
98
-
99
-
100
-
101
-
102
-
103
-
104
-
105
-
106
-
107
-
108
-
109
-
110
-
111
-
112
-
113
-
114
-
115
-
116
-
117
-
118
-
119
-
120
-
121
-
122
-
123
-
124
-
 125
125 -
 126
126 -
 127
127 -
 128
128 -
 129
129 -
 130
130 -
 131
131 -
 132
132 -
 133
133 -
 134
134 -
 135
135 -
 136
136 -
 137
137 -
 138
138 -
 139
139 -
 140
140 -
 141
141 -
 142
142 -
 143
143 -
 144
144 -
 145
145 -
146
-
147
-
148
-
149
-
150
-
151
-
152
-
153
-
154
-
155
-
156
-
157
-
158
-
159
-
160
-
161
-
162
-
163
-
164
-
165
-
166
-
167
-
168
-
169
-
170
-
171
-
172
-
173
-
174
-
175
-
176
-
177
-
178
-
179
-
180
-
181
-
182
-
183
-
184
-
185
-
186
-
187
-
188
-
189
-
190
-
191
-
192
-
193
-
194
-
195
-
196
-
197
-
198
-
199
-
200
-
201
-
202
-
203
-
204
-
205
-
206
-
207
-
208
-
209
-
210
-
211
-
212
-
213
-
214
-
215
-
216
-
217
-
218
-
219
-
220
-
221
-
222
-
223
-
224
-
225
-
226
-
227
-
228
 |
 |
Notes to Consolidated Financial Statements (Continued)
119
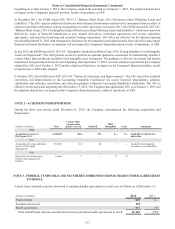
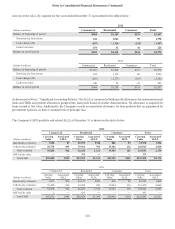
NOTE 6 - LOANS
Composition of Loan Portfolio
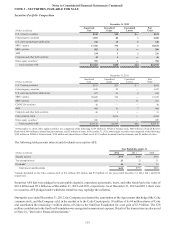
The composition of the Company's loan portfolio as of December 31 is shown in the following table:
(Dollars in millions) 2012 2011
Commercial loans:
Commercial & industrial $54,048 $49,538
Commercial real estate 4,127 5,094
Commercial construction 713 1,240
Total commercial loans 58,888 55,872
Residential loans:
Residential mortgages - guaranteed 4,252 6,672
Residential mortgages - nonguaranteed123,389 23,243
Home equity products 14,805 15,765
Residential construction 753 980
Total residential loans 43,199 46,660
Consumer loans:
Guaranteed student loans 5,357 7,199
Other direct 2,396 2,059
Indirect 10,998 10,165
Credit cards 632 540
Total consumer loans 19,383 19,963
LHFI 2$121,470 $122,495
LHFS $3,399 $2,353
1Includes $379 million and $431 million of loans carried at fair value at December 31, 2012 and 2011, respectively.
2Loans are presented net of unearned income, unamortized discounts and premiums, and net deferred loan costs of $639 million and $716 million at December
31, 2012 and 2011, respectively.
During the years ended December 31, 2012 and 2011, the Company transferred $3.7 billion and $754 million in LHFI to LHFS,
and $71 million and $63 million in LHFS to LHFI, respectively. Additionally, during the years ended December 31, 2012 and
2011, the Company sold $4.8 billion and $725 million in loans and leases for a loss of $3 million and a gain of $22 million,
respectively.
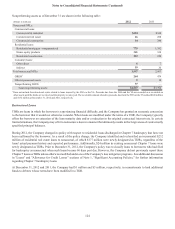
Credit Quality Evaluation
The Company evaluates the credit quality of its loan portfolio by employing a dual internal risk rating system, which assigns both
PD and LGD ratings to derive expected losses. Assignment of PD and LGD ratings are predicated upon numerous factors, including
consumer credit risk scores, rating agency information, borrower/guarantor financial capacity, LTV ratios, collateral type, debt
service coverage ratios, collection experience, other internal metrics/analysis, and qualitative assessments.
For the commercial portfolio, the Company believes that the most appropriate credit quality indicator is the individual loan’s risk
assessment expressed according to regulatory agency classification, Pass or Criticized. The Company's risk rating system is
granular, with multiple risk ratings in both the Pass and Criticized categories. Pass ratings reflect relatively low PDs; whereas,
criticized assets have a higher PD. The granularity in Pass ratings assists in the establishment of pricing, loan structures, approval
requirements, reserves, and ongoing credit management requirements. The Company conforms to the following regulatory
classifications for Criticized assets: Other Assets Especially Mentioned (or Special Mention), Adversely Classified, Doubtful, and
Loss. However, for the purposes of disclosure, management believes the most meaningful distinction within the Criticized categories
is between Accruing Criticized (which includes Special Mention and a portion of Adversely Classified) and Nonaccruing Criticized
(which includes a portion of Adversely Classified, Doubtful, and Loss). This distinction identifies those relatively higher risk loans
for which there is a basis to believe that the Company will collect all amounts due from those where full collection is less certain.