SunTrust 2012 Annual Report Download - page 117
Download and view the complete annual report
Please find page 117 of the 2012 SunTrust annual report below. You can navigate through the pages in the report by either clicking on the pages listed below, or by using the keyword search tool below to find specific information within the annual report.-
 1
1 -
2
-
3
-
4
-
5
-
6
-
7
-
8
-
9
-
10
-
11
-
12
-
13
-
14
-
15
-
16
-
17
-
18
-
19
-
20
-
21
-
22
-
23
-
24
-
25
-
26
-
27
-
28
-
29
-
30
-
31
-
32
-
33
-
34
-
35
-
36
-
37
-
38
-
39
-
40
-
41
-
42
-
43
-
44
-
45
-
46
-
47
-
48
-
49
-
50
-
51
-
52
-
53
-
54
-
55
-
56
-
57
-
58
-
59
-
60
-
61
-
62
-
63
-
64
-
65
-
66
-
67
-
68
-
69
-
70
-
71
-
72
-
73
-
74
-
75
-
76
-
77
-
78
-
79
-
80
-
81
-
82
-
83
-
84
-
85
-
86
-
87
-
88
-
89
-
90
-
91
-
92
-
93
-
94
-
95
-
96
-
97
-
98
-
99
-
100
-
101
-
102
-
103
-
104
-
105
-
106
-
 107
107 -
 108
108 -
 109
109 -
 110
110 -
 111
111 -
 112
112 -
 113
113 -
 114
114 -
 115
115 -
 116
116 -
 117
117 -
 118
118 -
 119
119 -
 120
120 -
 121
121 -
 122
122 -
 123
123 -
 124
124 -
 125
125 -
 126
126 -
 127
127 -
128
-
129
-
130
-
131
-
132
-
133
-
134
-
135
-
136
-
137
-
138
-
139
-
140
-
141
-
142
-
143
-
144
-
145
-
146
-
147
-
148
-
149
-
150
-
151
-
152
-
153
-
154
-
155
-
156
-
157
-
158
-
159
-
160
-
161
-
162
-
163
-
164
-
165
-
166
-
167
-
168
-
169
-
170
-
171
-
172
-
173
-
174
-
175
-
176
-
177
-
178
-
179
-
180
-
181
-
182
-
183
-
184
-
185
-
186
-
187
-
188
-
189
-
190
-
191
-
192
-
193
-
194
-
195
-
196
-
197
-
198
-
199
-
200
-
201
-
202
-
203
-
204
-
205
-
206
-
207
-
208
-
209
-
210
-
211
-
212
-
213
-
214
-
215
-
216
-
217
-
218
-
219
-
220
-
221
-
222
-
223
-
224
-
225
-
226
-
227
-
228
 |
 |

101
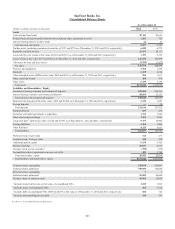
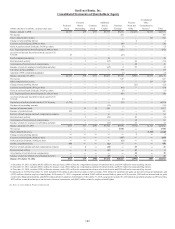
SunTrust Banks, Inc.
Consolidated Balance Sheets
As of December 31
(Dollars in millions and shares in thousands) 2012 2011
Assets
Cash and due from banks $7,134 $3,696
Federal funds sold and securities borrowed or purchased under agreements to resell 1,101 792
Interest-bearing deposits in other banks 22 21
Cash and cash equivalents 8,257 4,509
Trading assets (including encumbered securities of $727 and $770 as of December 31, 2012 and 2011, respectively) 6,049 6,279
Securities available for sale 21,953 28,117
Loans held for sale1 (loans at fair value: $3,243 and $2,141 as of December 31, 2012 and 2011, respectively) 3,399 2,353
Loans2 (loans at fair value: $379 and $433 as of December 31, 2012 and 2011, respectively) 121,470 122,495
Allowance for loan and lease losses (2,174) (2,457)
Net loans 119,296 120,038
Premises and equipment 1,564 1,564
Goodwill 6,369 6,344
Other intangible assets (MSRs at fair value: $899 and $921 as of December 31, 2012 and 2011, respectively) 956 1,017
Other real estate owned 264 479
Other assets 5,335 6,159
Total assets $173,442 $176,859
Liabilities and Shareholders’ Equity
Noninterest-bearing consumer and commercial deposits $39,481 $34,359
Interest-bearing consumer and commercial deposits 90,699 91,252
Total consumer and commercial deposits 130,180 125,611
Brokered time deposits (CDs at fair value: $832 and $1,018 as of December 31, 2012 and 2011, respectively) 2,136 2,281
Foreign deposits —30
Total deposits 132,316 127,922
Funds purchased 617 839
Securities sold under agreements to repurchase 1,574 1,644
Other short-term borrowings 3,303 8,983
Long-term debt 3 (debt at fair value: $1,622 and $1,997 as of December 31, 2012 and 2011, respectively) 9,357 10,908
Trading liabilities 1,161 1,806
Other liabilities 4,129 4,691
Total liabilities 152,457 156,793
Preferred stock, no par value 725 275
Common stock, $1.00 par value 550 550
Additional paid in capital 9,174 9,306
Retained earnings 10,817 8,978
Treasury stock, at cost, and other4(590) (792)
Accumulated other comprehensive income, net of tax 309 1,749
Total shareholders’ equity 20,985 20,066
Total liabilities and shareholders’ equity $173,442 $176,859
Common shares outstanding 538,959 536,967
Common shares authorized 750,000 750,000
Preferred shares outstanding 73
Preferred shares authorized 50,000 50,000
Treasury shares of common stock 10,962 12,954
1 Includes loans held for sale, at fair value, of consolidated VIEs $319 $315
2 Includes loans of consolidated VIEs 365 3,322
3 Includes debt of consolidated VIEs ($286 and $289 at fair value as of December 31, 2012 and 2011, respectively) 666 722
4 Includes noncontrolling interest held 114 107
See Notes to Consolidated Financial Statements.