SunTrust 2012 Annual Report Download - page 147
Download and view the complete annual report
Please find page 147 of the 2012 SunTrust annual report below. You can navigate through the pages in the report by either clicking on the pages listed below, or by using the keyword search tool below to find specific information within the annual report.-
 1
1 -
2
-
3
-
4
-
5
-
6
-
7
-
8
-
9
-
10
-
11
-
12
-
13
-
14
-
15
-
16
-
17
-
18
-
19
-
20
-
21
-
22
-
23
-
24
-
25
-
26
-
27
-
28
-
29
-
30
-
31
-
32
-
33
-
34
-
35
-
36
-
37
-
38
-
39
-
40
-
41
-
42
-
43
-
44
-
45
-
46
-
47
-
48
-
49
-
50
-
51
-
52
-
53
-
54
-
55
-
56
-
57
-
58
-
59
-
60
-
61
-
62
-
63
-
64
-
65
-
66
-
67
-
68
-
69
-
70
-
71
-
72
-
73
-
74
-
75
-
76
-
77
-
78
-
79
-
80
-
81
-
82
-
83
-
84
-
85
-
86
-
87
-
88
-
89
-
90
-
91
-
92
-
93
-
94
-
95
-
96
-
97
-
98
-
99
-
100
-
101
-
102
-
103
-
104
-
105
-
106
-
107
-
108
-
109
-
110
-
111
-
112
-
113
-
114
-
115
-
116
-
117
-
118
-
119
-
120
-
121
-
122
-
123
-
124
-
125
-
126
-
127
-
128
-
129
-
130
-
131
-
132
-
133
-
134
-
135
-
136
-
 137
137 -
 138
138 -
 139
139 -
 140
140 -
 141
141 -
 142
142 -
 143
143 -
 144
144 -
 145
145 -
 146
146 -
 147
147 -
 148
148 -
 149
149 -
 150
150 -
 151
151 -
 152
152 -
 153
153 -
 154
154 -
 155
155 -
 156
156 -
 157
157 -
158
-
159
-
160
-
161
-
162
-
163
-
164
-
165
-
166
-
167
-
168
-
169
-
170
-
171
-
172
-
173
-
174
-
175
-
176
-
177
-
178
-
179
-
180
-
181
-
182
-
183
-
184
-
185
-
186
-
187
-
188
-
189
-
190
-
191
-
192
-
193
-
194
-
195
-
196
-
197
-
198
-
199
-
200
-
201
-
202
-
203
-
204
-
205
-
206
-
207
-
208
-
209
-
210
-
211
-
212
-
213
-
214
-
215
-
216
-
217
-
218
-
219
-
220
-
221
-
222
-
223
-
224
-
225
-
226
-
227
-
228
 |
 |

Notes to Consolidated Financial Statements (Continued)
131
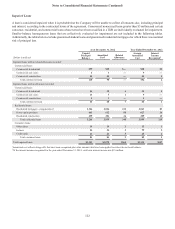
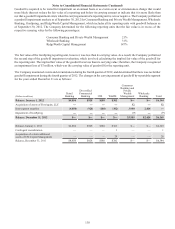
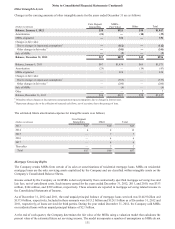
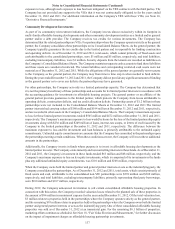
Other Intangible Assets
Changes in the carrying amounts of other intangible assets for the years ended December 31 are as follows:
(Dollars in millions)
Core Deposit
Intangibles
MSRs -
Fair Value Other Total
Balance, January 1, 2012 $38 $921 $58 $1,017
Amortization (21) — (18) (39)
MSRs originated — 336 — 336
Changes in fair value:
Due to changes in inputs and assumptions 1— (112) — (112)
Other changes in fair value 2— (241) — (241)
Sale of MSRs — (5) — (5)
Balance, December 31, 2012 $17 $899 $40 $956
Balance, January 1, 2011 $67 $1,439 $65 $1,571
Amortization (29) — (14) (43)
MSRs originated — 224 — 224
Changes in fair value:
Due to changes in inputs and assumptions 1— (533) — (533)
Other changes in fair value 2— (200) — (200)
Sale of MSRs — (9) — (9)
Other — — 7 7
Balance, December 31, 2011 $38 $921 $58 $1,017
1 Primarily reflects changes in discount rates and prepayment speed assumptions, due to changes in interest rates.
2 Represents changes due to the collection of expected cash flows, net of accretion, due to the passage of time.
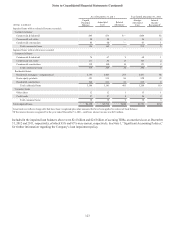
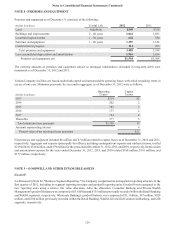
The estimated future amortization expense for intangible assets is as follows:
(Dollars in millions)
Core Deposit
Intangibles Other Total
2013 $13 $10 $23
2014 4 8 12
2015 —77
2016 —44
2017 —44
Thereafter —77
Total $17 $40 $57
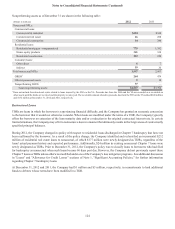
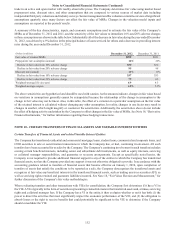
Mortgage Servicing Rights
The Company retains MSRs from certain of its sales or securitizations of residential mortgage loans. MSRs on residential
mortgage loans are the only servicing assets capitalized by the Company and are classified within intangible assets on the
Company’s Consolidated Balance Sheets.
Income earned by the Company on its MSRs is derived primarily from contractually specified mortgage servicing fees and
late fees, net of curtailment costs. Such income earned for the years ended December 31, 2012, 2011, and 2010, was $333
million, $364 million, and $399 million, respectively. These amounts are reported in mortgage servicing related income in
the Consolidated Statements of Income.
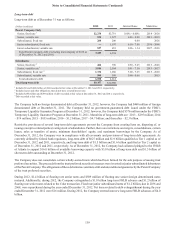
As of December 31, 2012 and 2011, the total unpaid principal balance of mortgage loans serviced was $144.9 billion and
$157.8 billion, respectively. Included in these amounts were $113.2 billion and $124.1 billion as of December 31, 2012 and
2011, respectively, of loans serviced for third parties. During the year ended December 31, 2012, the Company sold MSRs
on residential loans with an unpaid principal balance of $2.1 billion.
At the end of each quarter, the Company determines the fair value of the MSRs using a valuation model that calculates the
present value of the estimated future net servicing income. The model incorporates a number of assumptions as MSRs do not