SunTrust 2012 Annual Report Download - page 86
Download and view the complete annual report
Please find page 86 of the 2012 SunTrust annual report below. You can navigate through the pages in the report by either clicking on the pages listed below, or by using the keyword search tool below to find specific information within the annual report.-
 1
1 -
2
-
3
-
4
-
5
-
6
-
7
-
8
-
9
-
10
-
11
-
12
-
13
-
14
-
15
-
16
-
17
-
18
-
19
-
20
-
21
-
22
-
23
-
24
-
25
-
26
-
27
-
28
-
29
-
30
-
31
-
32
-
33
-
34
-
35
-
36
-
37
-
38
-
39
-
40
-
41
-
42
-
43
-
44
-
45
-
46
-
47
-
48
-
49
-
50
-
51
-
52
-
53
-
54
-
55
-
56
-
57
-
58
-
59
-
60
-
61
-
62
-
63
-
64
-
65
-
66
-
67
-
68
-
69
-
70
-
71
-
72
-
73
-
74
-
75
-
 76
76 -
 77
77 -
 78
78 -
 79
79 -
 80
80 -
 81
81 -
 82
82 -
 83
83 -
 84
84 -
 85
85 -
 86
86 -
 87
87 -
 88
88 -
 89
89 -
 90
90 -
 91
91 -
 92
92 -
 93
93 -
 94
94 -
 95
95 -
 96
96 -
97
-
98
-
99
-
100
-
101
-
102
-
103
-
104
-
105
-
106
-
107
-
108
-
109
-
110
-
111
-
112
-
113
-
114
-
115
-
116
-
117
-
118
-
119
-
120
-
121
-
122
-
123
-
124
-
125
-
126
-
127
-
128
-
129
-
130
-
131
-
132
-
133
-
134
-
135
-
136
-
137
-
138
-
139
-
140
-
141
-
142
-
143
-
144
-
145
-
146
-
147
-
148
-
149
-
150
-
151
-
152
-
153
-
154
-
155
-
156
-
157
-
158
-
159
-
160
-
161
-
162
-
163
-
164
-
165
-
166
-
167
-
168
-
169
-
170
-
171
-
172
-
173
-
174
-
175
-
176
-
177
-
178
-
179
-
180
-
181
-
182
-
183
-
184
-
185
-
186
-
187
-
188
-
189
-
190
-
191
-
192
-
193
-
194
-
195
-
196
-
197
-
198
-
199
-
200
-
201
-
202
-
203
-
204
-
205
-
206
-
207
-
208
-
209
-
210
-
211
-
212
-
213
-
214
-
215
-
216
-
217
-
218
-
219
-
220
-
221
-
222
-
223
-
224
-
225
-
226
-
227
-
228
 |
 |
70
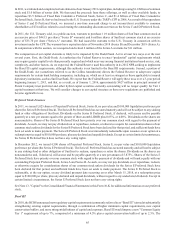
impact the accuracy of the assumptions underlying our mortgage repurchase reserve estimate. As previously discussed, the
level of repurchase requests we receive is dependent upon the actions of third parties and could differ from the assumptions
that we have made. Delinquency levels, delinquency roll rates, and our loss severity assumptions are all highly dependent
upon economic factors including changes in real estate values and unemployment levels which are, by nature, difficult to
predict. Loss severity assumptions could also be negatively impacted by delays in the foreclosure process which is a heightened
risk in some of the states where our loans sold were originated. Approximately 16% of the population of total loans sold
between January 1, 2006 and December 31, 2008 were sold to non-agency investors, some in the form of securitizations. Due
to the nature of these structures and the indirect ownership interests, the potential exists that investors, over time, will become
more successful in forcing additional repurchase demands. While we have used the best information available in estimating
the mortgage repurchase reserve liability, these and other factors, along with the discovery of additional information in the
future could result in changes in our assumptions which could materially impact our results of operations.
See "Noninterest Income" in this MD&A and Note 17, “Reinsurance Arrangements and Guarantees - Loan Sales,” to the
Consolidated Financial Statements in this Form 10-K for further discussion.
Legal and Regulatory Matters
We are parties to numerous claims and lawsuits arising in the course of our normal business activities, some of which involve
claims for substantial amounts, and the outcomes of which are not within our complete control or may not be known for
prolonged periods of time. Management is required to assess the probability of loss and amount of such loss, if any, in preparing
our financial statements.
We evaluate the likelihood of a potential loss from legal or regulatory proceedings to which we are a party. We record a liability
for such claims when a loss is considered probable and the amount can be reasonably estimated. The liability is recorded in
other liabilities in the Consolidated Balance Sheets and related expense is recorded in the applicable category of noninterest
expense, depending on the nature of the legal matter, in the Consolidated Statements of Income. Significant judgment may
be required in the determination of both probability and whether an exposure is reasonably estimable. Our estimates are
subjective based on the status of the legal or regulatory proceedings, the merits of our defenses, and consultation with in-
house and outside legal counsel. In many such proceedings, it is not possible to determine whether a liability has been incurred
or to estimate the ultimate or minimum amount of that liability until the matter is close to resolution. As additional information
becomes available, we reassess the potential liability related to pending claims and may revise our estimates.
Due to the inherent uncertainties of the legal and regulatory processes in the multiple jurisdictions in which we operate, our
estimates may be materially different than the actual outcomes, which could have material effects on our business, financial
conditions and results of operations. However, it is the opinion of management that liabilities arising from these claims in
excess of the amounts currently accrued, if any, will not have a material adverse impact to our financial condition, results of
operations, or cash flows. See Note 19, “Contingencies,” to the Consolidated Financial Statements in this Form 10-K for
further discussion.
Estimates of Fair Value
Fair value is the price that could be received to sell an asset or paid to transfer a liability in an orderly transaction between
market participants. Certain of our assets and liabilities are measured at fair value on a recurring basis. Examples of recurring
uses of fair value include derivative instruments, AFS and trading securities, certain LHFI and LHFS, certain issuances of
long term debt and brokered CDs, and MSRs. We also measure certain assets at fair value on a non-recurring basis either
when such assets are carried at the LOCOM, to evaluate assets for impairment, or for disclosure purposes. Examples of these
non-recurring uses of fair value include certain LHFS, OREO, goodwill, intangible assets, nonmarketable equity securities,
certain partnership investments, and long-lived assets. Depending on the nature of the asset or liability, we use various valuation
techniques and assumptions when estimating fair value.
The objective of fair value is to use market-based inputs or assumptions, when available, to estimate the price that would be
received to sell an asset or paid to transfer a liability in an orderly transaction between market participants at the measurement
date. Where observable market prices from transactions for identical assets or liabilities are not available, we identify what
we believe to be similar assets or liabilities. If observable market prices are unavailable or impracticable to obtain for any
such similar assets or liabilities, we look to other techniques by obtaining third party quotes or using modeling techniques,
such as discounted cash flows, while attempting to utilize market observable assumptions to the extent available. Absent
current market activity in that specific instrument or a similar instrument, the resulting valuation approach may require making
a number of significant judgments in the estimation of fair value. Market conditions during the credit crisis led to limited or
nonexistent trading in certain of the financial asset classes that we have owned. Although market conditions have improved
and we have seen the return of liquidity in certain markets, we continue to experience a low level of activity in a number of