SunTrust 2012 Annual Report Download - page 106
Download and view the complete annual report
Please find page 106 of the 2012 SunTrust annual report below. You can navigate through the pages in the report by either clicking on the pages listed below, or by using the keyword search tool below to find specific information within the annual report.-
 1
1 -
2
-
3
-
4
-
5
-
6
-
7
-
8
-
9
-
10
-
11
-
12
-
13
-
14
-
15
-
16
-
17
-
18
-
19
-
20
-
21
-
22
-
23
-
24
-
25
-
26
-
27
-
28
-
29
-
30
-
31
-
32
-
33
-
34
-
35
-
36
-
37
-
38
-
39
-
40
-
41
-
42
-
43
-
44
-
45
-
46
-
47
-
48
-
49
-
50
-
51
-
52
-
53
-
54
-
55
-
56
-
57
-
58
-
59
-
60
-
61
-
62
-
63
-
64
-
65
-
66
-
67
-
68
-
69
-
70
-
71
-
72
-
73
-
74
-
75
-
76
-
77
-
78
-
79
-
80
-
81
-
82
-
83
-
84
-
85
-
86
-
87
-
88
-
89
-
90
-
91
-
92
-
93
-
94
-
95
-
 96
96 -
 97
97 -
 98
98 -
 99
99 -
 100
100 -
 101
101 -
 102
102 -
 103
103 -
 104
104 -
 105
105 -
 106
106 -
 107
107 -
 108
108 -
 109
109 -
 110
110 -
 111
111 -
 112
112 -
 113
113 -
 114
114 -
 115
115 -
 116
116 -
117
-
118
-
119
-
120
-
121
-
122
-
123
-
124
-
125
-
126
-
127
-
128
-
129
-
130
-
131
-
132
-
133
-
134
-
135
-
136
-
137
-
138
-
139
-
140
-
141
-
142
-
143
-
144
-
145
-
146
-
147
-
148
-
149
-
150
-
151
-
152
-
153
-
154
-
155
-
156
-
157
-
158
-
159
-
160
-
161
-
162
-
163
-
164
-
165
-
166
-
167
-
168
-
169
-
170
-
171
-
172
-
173
-
174
-
175
-
176
-
177
-
178
-
179
-
180
-
181
-
182
-
183
-
184
-
185
-
186
-
187
-
188
-
189
-
190
-
191
-
192
-
193
-
194
-
195
-
196
-
197
-
198
-
199
-
200
-
201
-
202
-
203
-
204
-
205
-
206
-
207
-
208
-
209
-
210
-
211
-
212
-
213
-
214
-
215
-
216
-
217
-
218
-
219
-
220
-
221
-
222
-
223
-
224
-
225
-
226
-
227
-
228
 |
 |
90
Net interest income was $512 million, an increase of $41 million, or 9%, compared to the same period in 2011. The increase
was predominantly due to higher net interest income on loans and LHFS and reduced funding costs on lower MSR balances.
Residential mortgage loans increased $1.6 billion, or 6%, resulting in an increase in net interest income of $21 million. Net
interest income on LHFS increased $14 million due to a $964 million increase in average balances, partially offset by lower
loan spreads.
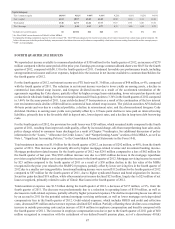
Provision for credit losses was $770 million, an increase of $77 million, or 11%, from the same period in 2011. The increase
was driven by charge-offs of $193 million related to nonperforming loan sales compared with $10 million of charge-offs
related to nonperforming loan sales in 2011. Additionally, policy changes related to second lien home equity loans and
discharged Chapter 7 bankruptcy loans added $70 million in net charge-offs in 2012. Excluding the incremental charge-offs
associated with nonperforming loan sales and policy changes, net charge-offs declined in 2012.
Noninterest income was $502 million in 2012, an increase of $261 million, compared to the same period in 2011 driven by
higher mortgage production and servicing income, partially offset by higher losses on the sale of Ginnie Mae loans in 2012.
Total mortgage production income for the year was $341 million, an increase of $361 million compared to prior year. Loan
production volume was $32.1 billion in 2012, an increase of $9.0 billion, or 39%, from the prior year resulting in higher gains
on sale and fee income. Additionally, the mortgage loan repurchase provision increased $211 million over the prior year largely
due to a provision in 2012 to cover expected losses on pre-2009 GSE demands.
Mortgage servicing income was $260 million, an increase of $36 million, or 16%, compared to 2011 due to favorable net
hedge performance, partially offset by higher decay and lower fee income. Additionally, 2011 included a $38 million reduction
of servicing income due to an increase in prepayment assumptions attributable to anticipated refinancing activity arising from
the HARP 2.0 program. Total loans serviced were $144.9 billion at December 31, 2012 compared with $157.8 billion at
December 31, 2011, down 8%.
Total noninterest expense was $1.4 billion, an increase of $182 million, or 15% compared to the same period in 2011. The
higher expenses were attributable to a $79 million increase in operating losses due to compliance-related costs, largely
associated with mortgage servicing and litigation expenses. Additionally, consulting expenses increased $44 million,
predominantly due to costs associated with the Federal Reserve Consent Order and other business initiatives. Total allocated
costs increased $73 million and staff expenses increased $48 million driven by costs associated with higher production volumes.
These increases were partially offset by lower agency compensatory fees and lower OREO expenses.
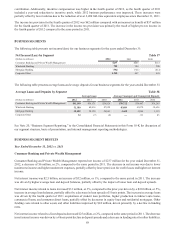
Corporate Other
Corporate Other's net income for the year ended December 31, 2012 was $1.5 billion, an increase of $1.1 billion, compared
to the same period in 2011. The increase was predominantly due to securities gains derived from the sale of Coke stock,
partially offset by lower interest income as a result of maturing interest rate swaps utilized to manage interest rate risk, lower
gains from the sale of other AFS securities, and a higher charitable contributions expense.
Net interest income was $391 million, a decrease of $111 million, or 22%, compared to the same period in 2011. The decrease
was primarily due to lower income from the aforementioned interest rate swaps and was partially offset by lower cost of funds
driven by a decrease in other assets. Total average assets decreased $3.4 billion, or 11%, predominantly due to reduction in
the investment portfolio. Average long-term debt decreased by $1.7 billion, or 14%, compared to 2011, primarily due to the
repayment of senior and subordinated debt. Average short-term borrowings increased $5.7 billion as our non-deposit funding
profile began to reflect a more normalized asset growth and balance sheet environment.
Total noninterest income was $2.0 billion, an increase of $1.7 billion, compared to the same period in 2011. The increase was
predominantly due to a $1.9 billion net gain on the sale of the Coke stock. These gains were partially offset by a $186 million
decrease in mark-to-market valuation on our public debt and index linked CDs carried at fair value, and a $83 million decrease
in net gains on the sale of other AFS securities.
Total noninterest expenses decreased $45 million compared to the same period in 2011. The decrease was mainly due to the
potential national mortgage servicing settlement claim expense recorded in 2011 and was partially offset by a $38 million
charitable contribution of the Coke stock to the SunTrust Foundation, higher severance expense, higher lease abandonment
charges related to office space utilization plan changes, and increased debt extinguishment charges in 2012 related to redemption
of higher cost trust preferred securities. The increase in total staff expense was due to a $60 million gain related to curtailment
of our pension plan net of a discretionary 401(k) contribution recognized in 2011 and increased incentive expenses in 2012
as a result of improved business performance.