SunTrust 2012 Annual Report Download - page 200
Download and view the complete annual report
Please find page 200 of the 2012 SunTrust annual report below. You can navigate through the pages in the report by either clicking on the pages listed below, or by using the keyword search tool below to find specific information within the annual report.-
 1
1 -
2
-
3
-
4
-
5
-
6
-
7
-
8
-
9
-
10
-
11
-
12
-
13
-
14
-
15
-
16
-
17
-
18
-
19
-
20
-
21
-
22
-
23
-
24
-
25
-
26
-
27
-
28
-
29
-
30
-
31
-
32
-
33
-
34
-
35
-
36
-
37
-
38
-
39
-
40
-
41
-
42
-
43
-
44
-
45
-
46
-
47
-
48
-
49
-
50
-
51
-
52
-
53
-
54
-
55
-
56
-
57
-
58
-
59
-
60
-
61
-
62
-
63
-
64
-
65
-
66
-
67
-
68
-
69
-
70
-
71
-
72
-
73
-
74
-
75
-
76
-
77
-
78
-
79
-
80
-
81
-
82
-
83
-
84
-
85
-
86
-
87
-
88
-
89
-
90
-
91
-
92
-
93
-
94
-
95
-
96
-
97
-
98
-
99
-
100
-
101
-
102
-
103
-
104
-
105
-
106
-
107
-
108
-
109
-
110
-
111
-
112
-
113
-
114
-
115
-
116
-
117
-
118
-
119
-
120
-
121
-
122
-
123
-
124
-
125
-
126
-
127
-
128
-
129
-
130
-
131
-
132
-
133
-
134
-
135
-
136
-
137
-
138
-
139
-
140
-
141
-
142
-
143
-
144
-
145
-
146
-
147
-
148
-
149
-
150
-
151
-
152
-
153
-
154
-
155
-
156
-
157
-
158
-
159
-
160
-
161
-
162
-
163
-
164
-
165
-
166
-
167
-
168
-
169
-
170
-
171
-
172
-
173
-
174
-
175
-
176
-
177
-
178
-
179
-
180
-
181
-
182
-
183
-
184
-
185
-
186
-
187
-
188
-
189
-
 190
190 -
 191
191 -
 192
192 -
 193
193 -
 194
194 -
 195
195 -
 196
196 -
 197
197 -
 198
198 -
 199
199 -
 200
200 -
 201
201 -
 202
202 -
 203
203 -
 204
204 -
 205
205 -
 206
206 -
 207
207 -
 208
208 -
 209
209 -
 210
210 -
211
-
212
-
213
-
214
-
215
-
216
-
217
-
218
-
219
-
220
-
221
-
222
-
223
-
224
-
225
-
226
-
227
-
228
 |
 |
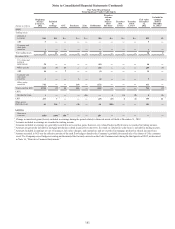
Notes to Consolidated Financial Statements (Continued)
184
Loans Held for Investment
LHFI consists predominantly of residential real estate loans discharged in Chapter 7 bankruptcy that have not been reaffirmed
by the borrower. As these loans have been classified as nonperforming, cash proceeds from the sale of the underlying collateral
is the expected source of repayment and these loans were charged down by $79 million in 2012 to the estimated fair value of
the underlying collateral, incorporating market data when available. LHFI also includes nonperforming commercial real estate
loans for which specific reserves have been recorded. Due to the lack of market data for similar assets, all of these loans are
considered level 3.
OREO
OREO is measured at the lower of cost or its fair value less costs to sell. Level 2 OREO consists primarily of residential
homes, commercial properties, and vacant lots and land for which current property-specific appraisals, broker pricing opinions,
or other market information is available. Level 3 OREO consists of lots and land for which initial valuations are based on
property-specific appraisals or internal valuations. Due to the lower dollar value per property and geographic dispersion of
the portfolio, these properties are re-evaluated using a pooled approach, which applies geographic factors to adjust carrying
values for estimated further declines in value. Land and lots have proven to be the most challenging asset class to accurately
value due in part to the low balance per property composition of the asset class. The pooled discount methodology provides
a means to reserve for losses across a broad band of assets rather than rely on potentially unreliable asset-specific valuations.
The pooled discount methodology is applied to land and lot assets that have valuations older than six months. The Company's
independent internal valuation group determines the discounts to be applied and the discount percentages are segregated by
state and by asset class (residential or commercial). The range of discount percentages applied to residential properties was
15% to 50% with a weighted average of 22%. The range of discount percentages applied to commercial properties was 10%
to 35% with a weighted average of 23%. The discount percentages reflect the general market decline/increase in a particular
state for a particular asset class and are determined by examining various valuation sources, including but not limited to, recent
appraisals or sales prices of similar assets within each state.
Affordable Housing
The Company evaluates its consolidated affordable housing properties for impairment whenever events or changes in
circumstances indicate that the carrying amount may not be recoverable. An impairment is recorded when the carrying amount
of the property exceeds its fair value. Fair value measurements for affordable housing properties are derived from internal
analyses using market assumptions when available. Significant assumptions utilized in these analyses include cash flows,
market capitalization rates, and tax credit market pricing. During 2012, the Company decided to dispose of certain consolidated
affordable housing properties, and accordingly, recorded an impairment charge to adjust the carrying values to estimated net
realizable values obtained from a third party broker opinion. The broker opinion also includes assumptions around cash flows,
market capitalization rates, and tax credit pricing. Due to the lack of comparable sales in the marketplace, these valuations
are considered level 3. During 2012, the Company recognized $96 million in impairment charges as a result of the Company's
decision to actively market for sale $0.2 billion in consolidated affordable housing properties. One of these consolidated
affordable housing properties was sold as of December 31, 2012 at an immaterial gain. During 2011, the Company recognized
impairment charges of $10 million on its consolidated affordable housing properties.
Other Assets
Other assets consist of private equity investments, other repossessed assets, assets under operating leases where the Company
is the lessor, and land held for sale.
Investments in private equity partnerships are valued based on the estimated expected remaining cash flows to be received
from these assets discounted at a market rate that is commensurate with their risk profile. Based on the valuation methodology
and the lack of observable inputs, these investments are considered level 3. During 2012, the Company initiated a disposition
strategy for the majority of its investments in private equity partnerships, many of which were ultimately sold in July 2012
at prices approximating their carrying value, with substantially all of the remainder subject to sale agreements that are expected
to settle in 2013 at prices approximating their carrying value.
Other repossessed assets consist of repossessed personal property that is measured at fair value less cost to sell. These assets
are considered level 2 as their fair value is determined based on market comparables and broker opinions. During 2012 and
2011, the Company recognized impairment charges of $2 million and $1 million, respectively, on these assets.
The Company monitors the fair value of assets under operating leases where the Company is the lessor and recognizes
impairment to the extent the carrying value is not recoverable and the fair value is less than its carrying value. Fair value is
determined using collateral specific pricing digests, external appraisals, and recent sales data from industry equipment dealers.
As market data for similar assets is available and used in the valuation, these assets are considered level 2. During 2012 and