SunTrust 2012 Annual Report Download - page 103
Download and view the complete annual report
Please find page 103 of the 2012 SunTrust annual report below. You can navigate through the pages in the report by either clicking on the pages listed below, or by using the keyword search tool below to find specific information within the annual report.-
 1
1 -
2
-
3
-
4
-
5
-
6
-
7
-
8
-
9
-
10
-
11
-
12
-
13
-
14
-
15
-
16
-
17
-
18
-
19
-
20
-
21
-
22
-
23
-
24
-
25
-
26
-
27
-
28
-
29
-
30
-
31
-
32
-
33
-
34
-
35
-
36
-
37
-
38
-
39
-
40
-
41
-
42
-
43
-
44
-
45
-
46
-
47
-
48
-
49
-
50
-
51
-
52
-
53
-
54
-
55
-
56
-
57
-
58
-
59
-
60
-
61
-
62
-
63
-
64
-
65
-
66
-
67
-
68
-
69
-
70
-
71
-
72
-
73
-
74
-
75
-
76
-
77
-
78
-
79
-
80
-
81
-
82
-
83
-
84
-
85
-
86
-
87
-
88
-
89
-
90
-
91
-
92
-
 93
93 -
 94
94 -
 95
95 -
 96
96 -
 97
97 -
 98
98 -
 99
99 -
 100
100 -
 101
101 -
 102
102 -
 103
103 -
 104
104 -
 105
105 -
 106
106 -
 107
107 -
 108
108 -
 109
109 -
 110
110 -
 111
111 -
 112
112 -
 113
113 -
114
-
115
-
116
-
117
-
118
-
119
-
120
-
121
-
122
-
123
-
124
-
125
-
126
-
127
-
128
-
129
-
130
-
131
-
132
-
133
-
134
-
135
-
136
-
137
-
138
-
139
-
140
-
141
-
142
-
143
-
144
-
145
-
146
-
147
-
148
-
149
-
150
-
151
-
152
-
153
-
154
-
155
-
156
-
157
-
158
-
159
-
160
-
161
-
162
-
163
-
164
-
165
-
166
-
167
-
168
-
169
-
170
-
171
-
172
-
173
-
174
-
175
-
176
-
177
-
178
-
179
-
180
-
181
-
182
-
183
-
184
-
185
-
186
-
187
-
188
-
189
-
190
-
191
-
192
-
193
-
194
-
195
-
196
-
197
-
198
-
199
-
200
-
201
-
202
-
203
-
204
-
205
-
206
-
207
-
208
-
209
-
210
-
211
-
212
-
213
-
214
-
215
-
216
-
217
-
218
-
219
-
220
-
221
-
222
-
223
-
224
-
225
-
226
-
227
-
228
 |
 |

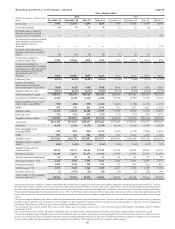
87
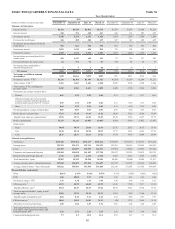
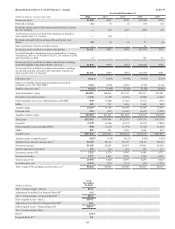
Capital Adequacy
Tier 1 common equity 10.04% 9.82% 9.40% 9.33% 9.22% 9.31% 9.22% 9.05%
Tier 1 capital 11.13 10.57 10.15 11.00 10.90 11.10 11.11 11.00
Total capital 13.48 12.95 12.84 13.73 13.67 13.91 14.01 13.92
Tier 1 leverage 8.91 8.49 8.15 8.77 8.75 8.90 8.92 8.72
1 Includes net securities gains $1 $1,941 $14 $18 $19 $2 $32 $64
2 See Non-GAAP reconcilements in Table 40 of this MD&A.
3 Computed by dividing noninterest expense by total revenue-FTE. The FTE basis adjusts for the tax-favored status of net interest income from certain loans and investments. We
believe this measure to be the preferred industry measurement of net interest income and it enhances comparability of net interest income arising from taxable and tax-exempt sources.
4 “NM” - not meaningful.
FOURTH QUARTER 2012 RESULTS
We reported net income available to common shareholders of $350 million for the fourth quarter of 2012, an increase of $279
million compared with the same period of the prior year. Earnings per average common diluted share were $0.65 for the fourth
quarter of 2012, compared with $0.13 for the fourth quarter of 2011. Continued favorable core performance trends, including
strong noninterest income and lower expenses, helped drive the increase in net income available to common shareholders for
the fourth quarter of 2012.
For the fourth quarter of 2012, net interest income on a FTE basis was $1.3 billion, a decrease of $48 million, or 4%, compared
with the fourth quarter of 2011. The reduction in net interest income was due to lower yields on earning assets, a decline in
commercial loan-related swap income, and foregone dividend income as a result of the accelerated termination of the
agreements regarding the Coke shares, partially offset by higher average loans outstanding, lower rates paid on deposits and
a reduction in wholesale funding. Net interest margin decreased 10 basis points to 3.36% in the fourth quarter of 2012 compared
to 3.46% for the same period of 2011. Loan yields declined 37 basis points as a result of the continuation of the low interest
rate environment and a decline of $40 million in commercial loan-related swap income. The yield on securities AFS declined
46 basis points and was due to a reduced portfolio, a decline in reinvestment rates, and the aforementioned foregone Coke
dividend. Declines in earning asset yields were partially offset by a 32 basis point decline in rates paid on interest-bearing
liabilities, primarily due to the favorable shift in deposit mix, lower deposit rates, and a decline in long-term debt borrowing
costs.
For the fourth quarter of 2012, the provision for credit losses was $328 million, which remained stable compared to the fourth
quarter of 2011, resulting from improved credit quality, offset by increased charge-offs from nonperforming loan sales and a
policy change related to consumer loans discharged as a result of Chapter 7 bankruptcy. See additional discussion of policy
information in the “Loans,” “Allowance for Credit Losses,” and “Nonperforming Assets” sections of this MD&A, as well as
Note 1, "Significant Accounting Policies," to the Consolidated Financial Statements in this Form 10-K.
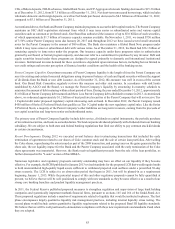
Total noninterest income was $1.0 billion for the fourth quarter of 2012, an increase of $292 million, or 40%, from the fourth
quarter of 2011. This increase was primarily driven by higher mortgage-related revenue and investment banking income.
Mortgage production-related income for the fourth quarter of 2012 was $241 million compared to a loss of $62 million for
the fourth quarter of last year. This $303 million increase was due to a $203 million decrease in the mortgage repurchase
provision coupled with higher core loan production income in the fourth quarter of 2012. Mortgage servicing income increased
by $23 million compared to the fourth quarter of 2011 as a result of a $38 million decline in the fair value of the MSRs
recognized in the prior year related to the HARP 2.0 program, partially offset by lower servicing fees in the fourth quarter of
2012 due to a smaller servicing portfolio. Investment banking income was a record $112 million for the fourth quarter of 2012
compared to $87 million for the fourth quarter of 2011, due to higher syndicated finance and bond origination fee income.
Securities gains declined $18 million, while other noninterest income declined $21 million, largely due to $25 million of net
losses recognized, primarily related to sales of Ginnie Mae loans in the fourth quarter of 2012.
Total noninterest expense was $1.5 billion during the fourth quarter of 2012, a decrease of $157 million, or 9%, from the
fourth quarter of 2011. The decrease was predominantly due to a reduction in operating losses of $139 million, as well as
decreases in credit-related expenses, partially offset by higher personnel expenses. The decline in operating losses was driven
by an accrual in 2011 for the potential national mortgage servicing settlement, as well as lower mortgage servicing-related
compensatory fees in the fourth quarter of 2012. Credit-related expenses, which includes OREO and credit and collection
costs, decreased $95 million and severance expenses declined $25 million. Partially offsetting these declines was a moderate
increase in outside processing costs and an increase of $114 million in employee compensation and benefits compared with
the fourth quarter of 2011. The increase in employee compensation was due in part to the fourth quarter of 2011 gain of $60
million recognized in connection with the curtailment of our defined benefit pension plans, net of a discretionary 401(k)