SunTrust 2012 Annual Report Download - page 134
Download and view the complete annual report
Please find page 134 of the 2012 SunTrust annual report below. You can navigate through the pages in the report by either clicking on the pages listed below, or by using the keyword search tool below to find specific information within the annual report.-
 1
1 -
2
-
3
-
4
-
5
-
6
-
7
-
8
-
9
-
10
-
11
-
12
-
13
-
14
-
15
-
16
-
17
-
18
-
19
-
20
-
21
-
22
-
23
-
24
-
25
-
26
-
27
-
28
-
29
-
30
-
31
-
32
-
33
-
34
-
35
-
36
-
37
-
38
-
39
-
40
-
41
-
42
-
43
-
44
-
45
-
46
-
47
-
48
-
49
-
50
-
51
-
52
-
53
-
54
-
55
-
56
-
57
-
58
-
59
-
60
-
61
-
62
-
63
-
64
-
65
-
66
-
67
-
68
-
69
-
70
-
71
-
72
-
73
-
74
-
75
-
76
-
77
-
78
-
79
-
80
-
81
-
82
-
83
-
84
-
85
-
86
-
87
-
88
-
89
-
90
-
91
-
92
-
93
-
94
-
95
-
96
-
97
-
98
-
99
-
100
-
101
-
102
-
103
-
104
-
105
-
106
-
107
-
108
-
109
-
110
-
111
-
112
-
113
-
114
-
115
-
116
-
117
-
118
-
119
-
120
-
121
-
122
-
123
-
 124
124 -
 125
125 -
 126
126 -
 127
127 -
 128
128 -
 129
129 -
 130
130 -
 131
131 -
 132
132 -
 133
133 -
 134
134 -
 135
135 -
 136
136 -
 137
137 -
 138
138 -
 139
139 -
 140
140 -
 141
141 -
 142
142 -
 143
143 -
 144
144 -
145
-
146
-
147
-
148
-
149
-
150
-
151
-
152
-
153
-
154
-
155
-
156
-
157
-
158
-
159
-
160
-
161
-
162
-
163
-
164
-
165
-
166
-
167
-
168
-
169
-
170
-
171
-
172
-
173
-
174
-
175
-
176
-
177
-
178
-
179
-
180
-
181
-
182
-
183
-
184
-
185
-
186
-
187
-
188
-
189
-
190
-
191
-
192
-
193
-
194
-
195
-
196
-
197
-
198
-
199
-
200
-
201
-
202
-
203
-
204
-
205
-
206
-
207
-
208
-
209
-
210
-
211
-
212
-
213
-
214
-
215
-
216
-
217
-
218
-
219
-
220
-
221
-
222
-
223
-
224
-
225
-
226
-
227
-
228
 |
 |

Notes to Consolidated Financial Statements (Continued)
118
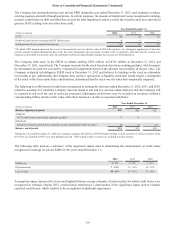
The Company has not purchased any new private MBS during the year ended December 31, 2012, and continues to reduce
existing exposure primarily through paydowns. In certain instances, the amount of impairment losses recognized in earnings
includes credit losses on debt securities that exceeds the total impairment, and as a result, the securities may have unrealized
gains in AOCI relating to factors other than credit.
Year Ended December 31
(Dollars in millions) 2012 2011 2010
OTTI1$1 $2 $2
Portion of gains/(losses) recognized in OCI (before taxes) 64 —
Net impairment losses recognized in earnings $7 $6 $2
1The initial OTTI amount represents the excess of the amortized cost over the fair value of AFS debt securities. For subsequent impairments of the same
security, amount includes additional declines in the fair value subsequent to the previously recorded OTTI, if applicable, until such time the security is no
longer in an unrealized loss position, plus any additional credit losses taken through earnings that exceeds the total impairment.
The Company held stock in the FHLB of Atlanta totaling $229 million and $342 million at December 31, 2012 and
December 31, 2011, respectively. The Company accounts for the stock based on relevant accounting guidance, which requires
the investment be carried at cost and be evaluated for impairment based on the ultimate recoverability of the par value. The
Company evaluated its holdings in FHLB stock at December 31, 2012 and believes its holdings in the stock are ultimately
recoverable at par. Additionally, the Company does not have operational or liquidity needs that would require a redemption
of the stock in the foreseeable future and therefore, determined that the stock was not other-than-temporarily impaired.
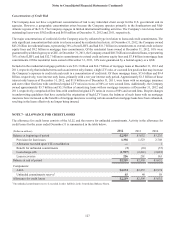
The following is a rollforward of credit losses recognized in earnings for the years ended December 31, 2012, 2011, and 2010,
related to securities for which the Company does not intend to sell and it is not more-likely-than-not that the Company will
be required to sell as of the end of each year presented. Subsequent credit losses may be recorded on securities without a
corresponding further decline in fair value when there has been a decline in expected cash flows.
Year Ended December 31
(Dollars in millions) 2012 2011 2010
Balance, beginning of period $25 $20 $22
Additions:
OTTI credit losses on previously impaired securities 76 — 1
Reductions:
Increases in expected cash flows recognized over the remaining life of the securities (1) (1) (2)
Balance, end of period $31 $25 $20
1During the year ended December 31, 2010, the Company recognized $2 million of OTTI through earnings on debt securities in which no portion of the
OTTI loss was included in OCI at any time during the period. OTTI related to these securities are excluded from this amount.
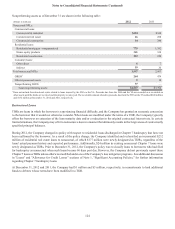
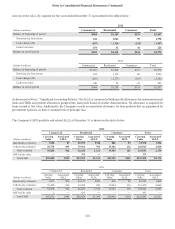
The following table presents a summary of the significant inputs used in determining the measurement of credit losses
recognized in earnings for private MBS for the years ended December 31:
2012 2011 2010
Default rate 2 - 9% 4 - 8% 2 - 7%
Prepayment rate 7 - 21% 12 - 22% 14 - 22%
Loss severity 40 - 56% 39 - 46% 37 - 46%
Assumption ranges represent the lowest and highest lifetime average estimates of each security for which credit losses were
recognized in earnings. During 2012, certain bonds experienced a deterioration in the significant inputs used to estimate
expected credit losses, which resulted in the recognition of additional impairment.