SunTrust 2012 Annual Report Download - page 211
Download and view the complete annual report
Please find page 211 of the 2012 SunTrust annual report below. You can navigate through the pages in the report by either clicking on the pages listed below, or by using the keyword search tool below to find specific information within the annual report.-
 1
1 -
2
-
3
-
4
-
5
-
6
-
7
-
8
-
9
-
10
-
11
-
12
-
13
-
14
-
15
-
16
-
17
-
18
-
19
-
20
-
21
-
22
-
23
-
24
-
25
-
26
-
27
-
28
-
29
-
30
-
31
-
32
-
33
-
34
-
35
-
36
-
37
-
38
-
39
-
40
-
41
-
42
-
43
-
44
-
45
-
46
-
47
-
48
-
49
-
50
-
51
-
52
-
53
-
54
-
55
-
56
-
57
-
58
-
59
-
60
-
61
-
62
-
63
-
64
-
65
-
66
-
67
-
68
-
69
-
70
-
71
-
72
-
73
-
74
-
75
-
76
-
77
-
78
-
79
-
80
-
81
-
82
-
83
-
84
-
85
-
86
-
87
-
88
-
89
-
90
-
91
-
92
-
93
-
94
-
95
-
96
-
97
-
98
-
99
-
100
-
101
-
102
-
103
-
104
-
105
-
106
-
107
-
108
-
109
-
110
-
111
-
112
-
113
-
114
-
115
-
116
-
117
-
118
-
119
-
120
-
121
-
122
-
123
-
124
-
125
-
126
-
127
-
128
-
129
-
130
-
131
-
132
-
133
-
134
-
135
-
136
-
137
-
138
-
139
-
140
-
141
-
142
-
143
-
144
-
145
-
146
-
147
-
148
-
149
-
150
-
151
-
152
-
153
-
154
-
155
-
156
-
157
-
158
-
159
-
160
-
161
-
162
-
163
-
164
-
165
-
166
-
167
-
168
-
169
-
170
-
171
-
172
-
173
-
174
-
175
-
176
-
177
-
178
-
179
-
180
-
181
-
182
-
183
-
184
-
185
-
186
-
187
-
188
-
189
-
190
-
191
-
192
-
193
-
194
-
195
-
196
-
197
-
198
-
199
-
200
-
 201
201 -
 202
202 -
 203
203 -
 204
204 -
 205
205 -
 206
206 -
 207
207 -
 208
208 -
 209
209 -
 210
210 -
 211
211 -
 212
212 -
 213
213 -
 214
214 -
 215
215 -
 216
216 -
 217
217 -
 218
218 -
 219
219 -
 220
220 -
 221
221 -
222
-
223
-
224
-
225
-
226
-
227
-
228
 |
 |

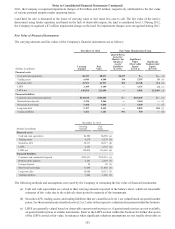
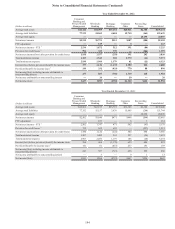
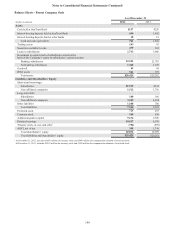
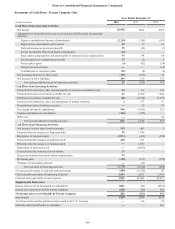
Notes to Consolidated Financial Statements (Continued)
195
Year Ended December 31, 2010
(Dollars in millions)
Consumer
Banking and
Private Wealth
Management
Wholesale
Banking
Mortgage
Banking
Corporate
Other
Reconciling
Items Consolidated
Average total assets $41,910 $62,268 $34,792 $32,581 $824 $172,375
Average total liabilities 74,914 51,925 4,030 18,775 (103) 149,541
Average total equity — — — — 22,834 22,834
Net interest income $2,449 $1,475 $438 $456 $36 $4,854
FTE adjustment — 106 — 10 — 116
Net interest income - FTE 12,449 1,581 438 466 36 4,970
Provision for credit losses 2891 777 1,187 — (204) 2,651
Net interest income/(loss) after provision for credit losses 1,558 804 (749) 466 240 2,319
Total noninterest income 1,539 1,442 521 257 (30) 3,729
Total noninterest expense 2,917 1,941 1,081 2 (30) 5,911
Income/(loss) before provision/(benefit) for income taxes 180 305 (1,309) 721 240 137
Provision/(benefit) for income taxes 365 17 (498) 247 100 (69)
Net income/(loss) including income attributable to
noncontrolling interest 115 288 (811) 474 140 206
Net income attributable to noncontrolling interest — 8 1 9 (1) 17
Net income/(loss) $115 $280 ($812) $465 $141 $189
1Net interest income is FTE and is presented on a matched maturity funds transfer price basis for the segments.
2Provision for credit losses represents net charge-offs for the segments.
3Includes regular income tax provision/(benefit) and taxable-equivalent income adjustment reversal.