SunTrust 2012 Annual Report Download - page 61
Download and view the complete annual report
Please find page 61 of the 2012 SunTrust annual report below. You can navigate through the pages in the report by either clicking on the pages listed below, or by using the keyword search tool below to find specific information within the annual report.
45
The loan types comprising our consumer loan segment include guaranteed student loans, other direct (consisting primarily
of direct auto loans, loans secured by negotiable collateral, and private student loans), indirect (consisting of loans secured
by automobiles, marine, or recreational vehicles), and consumer credit cards. The composition of our loan portfolio at December
31 is shown in the following table:
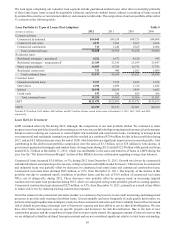
Loan Portfolio by Types of Loans (Post-Adoption) Table 5
(Dollars in millions) 2012 2011 2010 2009
Commercial loans:
Commercial & industrial $54,048 $49,538 $44,753 $44,008
Commercial real estate 4,127 5,094 6,167 6,694
Commercial construction 713 1,240 2,568 4,984
Total commercial loans 58,888 55,872 53,488 55,686
Residential loans:
Residential mortgages - guaranteed 4,252 6,672 4,520 949
Residential mortgages - nonguaranteed123,389 23,243 23,959 25,847
Home equity products 14,805 15,765 16,751 17,783
Residential construction 753 980 1,291 1,909
Total residential loans 43,199 46,660 46,521 46,488
Consumer loans:
Guaranteed student loans 5,357 7,199 4,260 2,786
Other direct 2,396 2,059 1,722 1,484
Indirect 10,998 10,165 9,499 6,665
Credit cards 632 540 485 566
Total consumer loans 19,383 19,963 15,966 11,501
LHFI $121,470 $122,495 $115,975 $113,675
LHFS $3,399 $2,353 $3,501 $4,670
1Includes $379 million, $431 million, $488 million, and $437 million of loans carried at fair value at December 31, 2012, 2011, 2010, and 2009,
respectively.
Loans Held for Investment
LHFI remained relatively flat during 2012; although, the composition of our loan portfolio shifted. We continued to make
progress in our loan portfolio diversification strategy, as we were successful in both growing targeted commercial and consumer
balances and in reducing our exposure to certain higher risk residential and construction loans. Continuing to manage down
our commercial and residential construction portfolios resulted in a combined $754 million decline in these portfolios during
2012 and an $8.5 billion decrease since the end of 2008, which has driven a significant improvement in our risk profile. Also
contributing to this shift in loan portfolio composition were the sales of $3.3 billion, net of $78 million in write-downs, in
government-guaranteed mortgages and student loans. Average loans during 2012 totaled $122.9 billion while period-end loans
totaled $121.5 billion at December 31, 2012, which was attributable to the sales and transfers of loans to LHFS during the
year. See the "Net Interest Income/Margin" section of this MD&A for more information regarding average loan balances.
Commercial loans increased $3.0 billion, or 5%, during 2012 from December 31, 2011. Growth was driven by commercial
and industrial loans encompassing a diverse array of large corporate and middle market borrowers. This increase in commercial
and industrial loans was partially offset by decreases in commercial real estate loans and commercial construction loans.
Commercial real estate loans declined $967 million, or 19%, from December 31, 2011. The majority of the decline in this
portfolio was due to continued runoff, resolution of problem loans, and the sale of $161 million of commercial real estate
NPLs, net of charge-offs, during 2012. These decreases were partially offset by progress made in increasing targeted
commercial real estate loan production during 2012, where we anticipate seeing some portfolio growth in coming quarters.
Commercial construction loans decreased $527 million, or 43%, from December 31, 2011, primarily as a result of our efforts
to reduce risk levels by reducing existing construction exposure.
Given the stresses in the commercial real estate market, we continue to be proactive in our credit monitoring and management
processes to provide early warning of problem loans. At least annually and more frequently if credit quality deteriorates, we
perform a thorough liquidity and contingency analysis of our commercial real estate portfolio to identify loans with an increased
risk of default by providing a thorough view of borrowers' capacity and their ability to service their debt obligations. We also
have strict limits and exposure caps on specific projects and borrowers for risk diversification. Due to the lack of new
construction projects and the completion of many that were previously started, the aggregate amount of interest reserves that
we are obligated to fund has declined from prior periods and are not considered significant relative to total loans outstanding.


