SunTrust 2012 Annual Report Download - page 167
Download and view the complete annual report
Please find page 167 of the 2012 SunTrust annual report below. You can navigate through the pages in the report by either clicking on the pages listed below, or by using the keyword search tool below to find specific information within the annual report.-
 1
1 -
2
-
3
-
4
-
5
-
6
-
7
-
8
-
9
-
10
-
11
-
12
-
13
-
14
-
15
-
16
-
17
-
18
-
19
-
20
-
21
-
22
-
23
-
24
-
25
-
26
-
27
-
28
-
29
-
30
-
31
-
32
-
33
-
34
-
35
-
36
-
37
-
38
-
39
-
40
-
41
-
42
-
43
-
44
-
45
-
46
-
47
-
48
-
49
-
50
-
51
-
52
-
53
-
54
-
55
-
56
-
57
-
58
-
59
-
60
-
61
-
62
-
63
-
64
-
65
-
66
-
67
-
68
-
69
-
70
-
71
-
72
-
73
-
74
-
75
-
76
-
77
-
78
-
79
-
80
-
81
-
82
-
83
-
84
-
85
-
86
-
87
-
88
-
89
-
90
-
91
-
92
-
93
-
94
-
95
-
96
-
97
-
98
-
99
-
100
-
101
-
102
-
103
-
104
-
105
-
106
-
107
-
108
-
109
-
110
-
111
-
112
-
113
-
114
-
115
-
116
-
117
-
118
-
119
-
120
-
121
-
122
-
123
-
124
-
125
-
126
-
127
-
128
-
129
-
130
-
131
-
132
-
133
-
134
-
135
-
136
-
137
-
138
-
139
-
140
-
141
-
142
-
143
-
144
-
145
-
146
-
147
-
148
-
149
-
150
-
151
-
152
-
153
-
154
-
155
-
156
-
 157
157 -
 158
158 -
 159
159 -
 160
160 -
 161
161 -
 162
162 -
 163
163 -
 164
164 -
 165
165 -
 166
166 -
 167
167 -
 168
168 -
 169
169 -
 170
170 -
 171
171 -
 172
172 -
 173
173 -
 174
174 -
 175
175 -
 176
176 -
 177
177 -
178
-
179
-
180
-
181
-
182
-
183
-
184
-
185
-
186
-
187
-
188
-
189
-
190
-
191
-
192
-
193
-
194
-
195
-
196
-
197
-
198
-
199
-
200
-
201
-
202
-
203
-
204
-
205
-
206
-
207
-
208
-
209
-
210
-
211
-
212
-
213
-
214
-
215
-
216
-
217
-
218
-
219
-
220
-
221
-
222
-
223
-
224
-
225
-
226
-
227
-
228
 |
 |

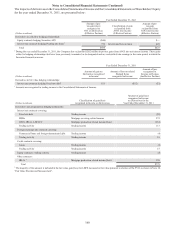
Notes to Consolidated Financial Statements (Continued)
151
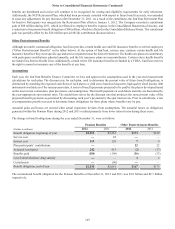
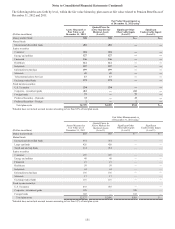
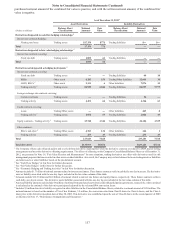
The following tables sets forth by level, within the fair value hierarchy, plan assets at fair value related to Pension Benefits as of
December 31, 2012 and 2011:
Fair Value Measurements as
of December 31, 2012 using 1
(Dollars in millions)
Assets Measured at
Fair Value as of
December 31, 2012
Quoted Prices In
Active Markets for
Identical Assets
(Level 1)
Significant Other
Observable Inputs
(Level 2)
Significant
Unobservable Inputs
(Level 3)
Money market funds $48 $48 $— $—
Mutual funds:
International diversified funds 401 401 — —
Equity securities:
Consumer 218 218 — —
Energy and utilities 127 127 — —
Financials 136 136 — —
Healthcare 111 111 — —
Industrials 197 197 — —
Information technology 199 199 — —
Materials 45 45 — —
Telecommunications Services 17 17 — —
Exchange traded funds 172 172 — —
Fixed income securities:
U.S. Treasuries 534 534 — —
Corporate - investment grade 412 — 412 —
Foreign bonds 77 — 77 —
Preferred Securities - Domestic 33 — 33 —
Preferred Securities - Foreign 2 — 2 —
Total plan assets $2,729 $2,205 $524 $—
1Schedule does not include accrued income amounting to less than 0.5% of total plan assets.
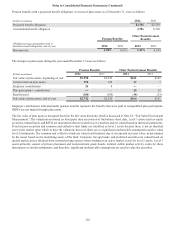
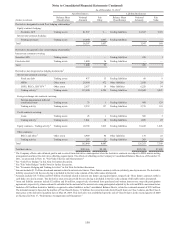
Fair Value Measurements as
of December 31, 2011 using 1
(Dollars in millions)
Assets Measured at
Fair Value as of
December 31, 2011
Quoted Prices In
Active Markets for
Identical Assets
(Level 1)
Significant Other
Observable Inputs
(Level 2)
Significant
Unobservable Inputs
(Level 3)
Money market funds $45 $45 $— $—
Mutual funds:
International diversified funds 351 351 — —
Large cap funds 426 426 — —
Small and mid cap funds 214 214 — —
Equity securities:
Consumer 107 107 — —
Energy and utilities 48 48 — —
Financials 21 21 — —
Healthcare 58 58 — —
Industrials 62 62 — —
Information technology 136 136 — —
Materials 17 17 — —
Exchange traded funds 116 116 — —
Fixed income securities:
U.S. Treasuries 435 435 — —
Corporate - investment grade 398 — 398 —
Foreign bonds 103 — 103 —
Total plan assets $2,537 $2,036 $501 $—
1Schedule does not include accrued income amounting to less than 0.5% of total plan assets.