SunTrust 2012 Annual Report Download - page 104
Download and view the complete annual report
Please find page 104 of the 2012 SunTrust annual report below. You can navigate through the pages in the report by either clicking on the pages listed below, or by using the keyword search tool below to find specific information within the annual report.-
 1
1 -
2
-
3
-
4
-
5
-
6
-
7
-
8
-
9
-
10
-
11
-
12
-
13
-
14
-
15
-
16
-
17
-
18
-
19
-
20
-
21
-
22
-
23
-
24
-
25
-
26
-
27
-
28
-
29
-
30
-
31
-
32
-
33
-
34
-
35
-
36
-
37
-
38
-
39
-
40
-
41
-
42
-
43
-
44
-
45
-
46
-
47
-
48
-
49
-
50
-
51
-
52
-
53
-
54
-
55
-
56
-
57
-
58
-
59
-
60
-
61
-
62
-
63
-
64
-
65
-
66
-
67
-
68
-
69
-
70
-
71
-
72
-
73
-
74
-
75
-
76
-
77
-
78
-
79
-
80
-
81
-
82
-
83
-
84
-
85
-
86
-
87
-
88
-
89
-
90
-
91
-
92
-
93
-
 94
94 -
 95
95 -
 96
96 -
 97
97 -
 98
98 -
 99
99 -
 100
100 -
 101
101 -
 102
102 -
 103
103 -
 104
104 -
 105
105 -
 106
106 -
 107
107 -
 108
108 -
 109
109 -
 110
110 -
 111
111 -
 112
112 -
 113
113 -
 114
114 -
115
-
116
-
117
-
118
-
119
-
120
-
121
-
122
-
123
-
124
-
125
-
126
-
127
-
128
-
129
-
130
-
131
-
132
-
133
-
134
-
135
-
136
-
137
-
138
-
139
-
140
-
141
-
142
-
143
-
144
-
145
-
146
-
147
-
148
-
149
-
150
-
151
-
152
-
153
-
154
-
155
-
156
-
157
-
158
-
159
-
160
-
161
-
162
-
163
-
164
-
165
-
166
-
167
-
168
-
169
-
170
-
171
-
172
-
173
-
174
-
175
-
176
-
177
-
178
-
179
-
180
-
181
-
182
-
183
-
184
-
185
-
186
-
187
-
188
-
189
-
190
-
191
-
192
-
193
-
194
-
195
-
196
-
197
-
198
-
199
-
200
-
201
-
202
-
203
-
204
-
205
-
206
-
207
-
208
-
209
-
210
-
211
-
212
-
213
-
214
-
215
-
216
-
217
-
218
-
219
-
220
-
221
-
222
-
223
-
224
-
225
-
226
-
227
-
228
 |
 |

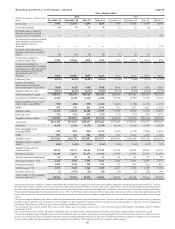
88
contribution. Additionally, incentive compensation was higher in the fourth quarter of 2012, as the fourth quarter of 2011
included a year-end reduction to incentive pools, while 2012 business performance was improved. These increases were
partially offset by lower salaries due to the reduction of over 2,400 full-time equivalent employees since December 31, 2011.
The income tax provision for the fourth quarter of 2012 was $62 million compared with an income tax benefit of $57 million
for the fourth quarter of 2011. The increase in the income tax provision was primarily the result of higher pre-tax income in
the fourth quarter of 2012 compared to the same period in 2011.
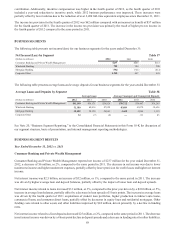
BUSINESS SEGMENTS
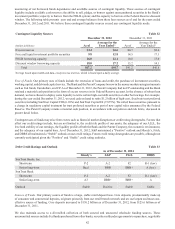
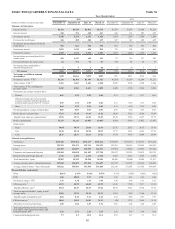
The following table presents net income/(loss) for our business segments for the years ended December 31:
Net Income/(Loss) by Segment Table 37
(Dollars in millions) 2012 2011 2010
Consumer Banking and Private Wealth Management $237 $243 $115
Wholesale Banking 789 384 280
Mortgage Banking (702) (721) (812)
Corporate Other 1,520 447 465
The following table presents average loans and average deposits for our business segments for the years ended December 31:
Average Loans and Deposits by Segment Table 38
Average Loans Average Consumer and Commercial Deposits
(Dollars in millions) 2012 2011 2010 2012 2011 2010
Consumer Banking and Private Wealth Management $41,190 $39,171 $36,929 $76,722 $76,407 $74,295
Wholesale Banking 51,380 48,016 47,959 45,889 43,070 39,656
Mortgage Banking 30,289 29,128 29,043 3,638 3,084 3,135
Corporate Other 34 (7) (6) —111 43
See Note 20, “Business Segment Reporting,” to the Consolidated Financial Statements in this Form 10-K for discussion of
our segment structure, basis of presentation, and internal management reporting methodologies.
BUSINESS SEGMENT RESULTS
Year Ended December 31, 2012 vs. 2011
Consumer Banking and Private Wealth Management
Consumer Banking and Private Wealth Management reported net income of $237 million for the year ended December 31,
2012, a decrease of $6 million, or 2%, compared to the same period in 2011. The decrease in net income was due to lower
noninterest income and higher noninterest expenses, partially offset by lower provision for credit losses and higher net interest
income.
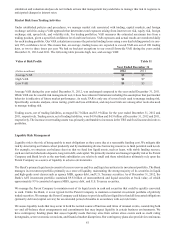
Net interest income was $2.5 billion, an increase of $32 million, or 1%, compared to the same period in 2011. The increase
was driven by higher average loan and deposit balances, partially offset by the impact of lower loan and deposit spreads.
Net interest income related to loans increased $31 million, or 3%, compared to the prior year driven by a $2.0 billion, or 5%,
increase in average loan balances, partially offset by a decrease in loan spreads of 5 basis points. The increase in average loans
was driven by the fourth quarter of 2011 acquisitions of student loan portfolios, higher production in indirect auto loans,
commercial loans, and consumer direct loans, partially offset by decreases in equity lines and residential mortgages. Other
funding costs related to other assets and other liabilities improved by $24 million, driven primarily by a decline in funding
rates.
Net interest income related to client deposits decreased $25 million, or 2%, compared to the same period in 2011. The decrease
in net interest income was driven by a 4 basis point decline in deposit spreads and a decrease in funding rates for other liabilities.