SunTrust 2012 Annual Report Download - page 89
Download and view the complete annual report
Please find page 89 of the 2012 SunTrust annual report below. You can navigate through the pages in the report by either clicking on the pages listed below, or by using the keyword search tool below to find specific information within the annual report.-
 1
1 -
2
-
3
-
4
-
5
-
6
-
7
-
8
-
9
-
10
-
11
-
12
-
13
-
14
-
15
-
16
-
17
-
18
-
19
-
20
-
21
-
22
-
23
-
24
-
25
-
26
-
27
-
28
-
29
-
30
-
31
-
32
-
33
-
34
-
35
-
36
-
37
-
38
-
39
-
40
-
41
-
42
-
43
-
44
-
45
-
46
-
47
-
48
-
49
-
50
-
51
-
52
-
53
-
54
-
55
-
56
-
57
-
58
-
59
-
60
-
61
-
62
-
63
-
64
-
65
-
66
-
67
-
68
-
69
-
70
-
71
-
72
-
73
-
74
-
75
-
76
-
77
-
78
-
 79
79 -
 80
80 -
 81
81 -
 82
82 -
 83
83 -
 84
84 -
 85
85 -
 86
86 -
 87
87 -
 88
88 -
 89
89 -
 90
90 -
 91
91 -
 92
92 -
 93
93 -
 94
94 -
 95
95 -
 96
96 -
 97
97 -
 98
98 -
 99
99 -
100
-
101
-
102
-
103
-
104
-
105
-
106
-
107
-
108
-
109
-
110
-
111
-
112
-
113
-
114
-
115
-
116
-
117
-
118
-
119
-
120
-
121
-
122
-
123
-
124
-
125
-
126
-
127
-
128
-
129
-
130
-
131
-
132
-
133
-
134
-
135
-
136
-
137
-
138
-
139
-
140
-
141
-
142
-
143
-
144
-
145
-
146
-
147
-
148
-
149
-
150
-
151
-
152
-
153
-
154
-
155
-
156
-
157
-
158
-
159
-
160
-
161
-
162
-
163
-
164
-
165
-
166
-
167
-
168
-
169
-
170
-
171
-
172
-
173
-
174
-
175
-
176
-
177
-
178
-
179
-
180
-
181
-
182
-
183
-
184
-
185
-
186
-
187
-
188
-
189
-
190
-
191
-
192
-
193
-
194
-
195
-
196
-
197
-
198
-
199
-
200
-
201
-
202
-
203
-
204
-
205
-
206
-
207
-
208
-
209
-
210
-
211
-
212
-
213
-
214
-
215
-
216
-
217
-
218
-
219
-
220
-
221
-
222
-
223
-
224
-
225
-
226
-
227
-
228
 |
 |
73
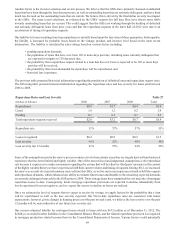
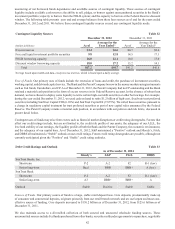
securities, some of which are only redeemable with the issuer at par and cannot be traded in the market; as such, no significant
observable market data for these instruments is available. These nonmarketable securities AFS totaled approximately $653
million at December 31, 2012. The remaining level 3 securities, both trading assets and securities AFS, are predominantly
private ABS and MBS and CDOs, including interests retained from Company-sponsored securitizations or purchased from
third party securitizations. We also have exposure to bank trust preferred CDOs, student loan ABS, and municipal securities
due to our purchase of certain ARS as a result of failed auctions. For all level 3 securities, little or no market activity exists
for either the security or the underlying collateral and therefore the significant assumptions used to value the securities are
not market observable.
Level 3 trading assets increased by $9 million, or 18%, during the year ended December 31, 2012, primarily due to net
unrealized mark-to-market gains and a small amount of purchases, partially offset by sales, paydowns, redemptions, and
maturities of securities. Level 3 securities AFS declined by $127 million, or 12%, during the year ended December 31, 2012,
due to continued paydowns and redemptions by issuers of securities, partially offset by net unrealized mark-to-market gains
and a small amount of FHLB of Atlanta stock purchases. During the year ended December 31, 2012, we recognized through
earnings $300 million in net losses related to trading assets and liabilities and securities AFS classified as level 3, primarily
due to the $304 million net loss related to the terminated cash flow hedge reclassification from AOCI to earnings relative to
the settled Coke derivatives during 2012.
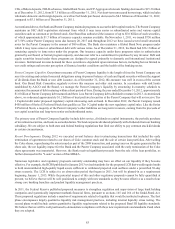
Loans
The fair values of LHFI and LHFS are based on observable current market prices in the secondary loan market in which loans
trade, as either whole loans or as ABS. When securities prices are obtained in the secondary loan market, we will translate
these prices into whole loan prices by incorporating adjustments for estimated credit enhancement costs, loan servicing fees,
and various other transformation costs, when material. The fair value of a loan is impacted by the nature of the asset and the
market liquidity. Level 3 loans are predominantly mortgage loans that have been deemed not marketable, largely due to
borrower defaults or the identification of other loan defects. When estimating fair value for these loans, we use a discounted
cash flow approach based on assumptions that are generally not observable in the current markets, such as prepayment speeds,
default rates, loss severity rates, and liquidity discounts. Absent comparable current market data, we believe that the fair value
derived from these various approaches is a reasonable approximation of the prices that we would receive upon sale of the
loans.
Other Intangible Assets and Other Assets
We record all MSRs at fair value on a recurring basis. The fair value of MSRs is based on discounted cash flow analyses and
can be highly variable quarter to quarter as market conditions and projected interest rates change. We provide disclosure of
the key economic assumptions used to measure MSRs and residual interests and a sensitivity analysis to adverse changes to
these assumptions in Note 9, “Goodwill and Other Intangible Assets,” to the Consolidated Financial Statements in this Form
10-K. This sensitivity analysis does not take into account hedging activities discussed in the “Other Market Risk” section of
this MD&A.
The fair values of OREO and other repossessed assets are typically determined based on recent appraisals by third parties
and other market information. Our OREO properties are concentrated in Georgia, Florida, and North Carolina. Further
deterioration in property values in those states or changes to our disposition strategies could cause our estimates of OREO
values to decline which would result in further write-downs. Estimates of fair value are also required when performing an
impairment analysis of goodwill, intangible assets, and long-lived assets. For long-lived assets, including intangible assets
subject to amortization, an impairment loss is recognized if the carrying amount of the asset is not recoverable and exceeds
its fair value. In determining the fair value, management uses models which require assumptions about growth rates, the life
of the asset, and/or the market value of the assets. We test long-lived assets for impairment whenever events or changes in
circumstances indicate that our carrying amount may not be recoverable.
Other Liabilities
The fair value methodology and assumptions related to our IRLCs is described in Note 18, “Fair Value Election and
Measurement,” to the Consolidated Financial Statements in this Form 10-K.
Goodwill
As of December 31, 2012, our reporting units with goodwill balances were Consumer Banking and Private Wealth Management,
Wholesale Banking and Ridgeworth Capital Management. As of December 31, 2011, our reporting units with goodwill
balances were Branch Banking, Diversified Commercial Banking, CIB, and W&IM. See Note 20, "Business Segment