SunTrust 2012 Annual Report Download - page 150
Download and view the complete annual report
Please find page 150 of the 2012 SunTrust annual report below. You can navigate through the pages in the report by either clicking on the pages listed below, or by using the keyword search tool below to find specific information within the annual report.-
 1
1 -
2
-
3
-
4
-
5
-
6
-
7
-
8
-
9
-
10
-
11
-
12
-
13
-
14
-
15
-
16
-
17
-
18
-
19
-
20
-
21
-
22
-
23
-
24
-
25
-
26
-
27
-
28
-
29
-
30
-
31
-
32
-
33
-
34
-
35
-
36
-
37
-
38
-
39
-
40
-
41
-
42
-
43
-
44
-
45
-
46
-
47
-
48
-
49
-
50
-
51
-
52
-
53
-
54
-
55
-
56
-
57
-
58
-
59
-
60
-
61
-
62
-
63
-
64
-
65
-
66
-
67
-
68
-
69
-
70
-
71
-
72
-
73
-
74
-
75
-
76
-
77
-
78
-
79
-
80
-
81
-
82
-
83
-
84
-
85
-
86
-
87
-
88
-
89
-
90
-
91
-
92
-
93
-
94
-
95
-
96
-
97
-
98
-
99
-
100
-
101
-
102
-
103
-
104
-
105
-
106
-
107
-
108
-
109
-
110
-
111
-
112
-
113
-
114
-
115
-
116
-
117
-
118
-
119
-
120
-
121
-
122
-
123
-
124
-
125
-
126
-
127
-
128
-
129
-
130
-
131
-
132
-
133
-
134
-
135
-
136
-
137
-
138
-
139
-
 140
140 -
 141
141 -
 142
142 -
 143
143 -
 144
144 -
 145
145 -
 146
146 -
 147
147 -
 148
148 -
 149
149 -
 150
150 -
 151
151 -
 152
152 -
 153
153 -
 154
154 -
 155
155 -
 156
156 -
 157
157 -
 158
158 -
 159
159 -
 160
160 -
161
-
162
-
163
-
164
-
165
-
166
-
167
-
168
-
169
-
170
-
171
-
172
-
173
-
174
-
175
-
176
-
177
-
178
-
179
-
180
-
181
-
182
-
183
-
184
-
185
-
186
-
187
-
188
-
189
-
190
-
191
-
192
-
193
-
194
-
195
-
196
-
197
-
198
-
199
-
200
-
201
-
202
-
203
-
204
-
205
-
206
-
207
-
208
-
209
-
210
-
211
-
212
-
213
-
214
-
215
-
216
-
217
-
218
-
219
-
220
-
221
-
222
-
223
-
224
-
225
-
226
-
227
-
228
 |
 |
Notes to Consolidated Financial Statements (Continued)
134
VIE have no recourse to the general credit of the Company, as the liabilities of the CLO are paid only to the extent
of available cash flows from the CLO’s assets.
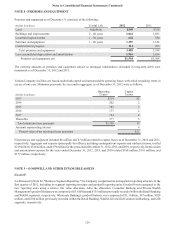
For the remaining CLOs, which are also considered to be VIEs, the Company has determined that it is not the primary
beneficiary as it does not have an obligation to absorb losses or the right to receive benefits from the entities that
could potentially be significant to the VIE. The Company's preference share exposure was valued at $3 million as
of December 31, 2012 and $2 million as of December 31, 2011. The Company’s only remaining involvement with
these VIEs is through its collateral manager role. The Company receives fees for managing the assets of these vehicles;
these fees are considered adequate compensation and are commensurate with the level of effort required to provide
such services. The fees received by the Company from these entities are recorded as trust and investment management
income in the Consolidated Statements of Income. Senior fees earned by the Company are generally not considered
at risk; however, subordinate fees earned by the Company are subject to the availability of cash flows and to the
priority of payments. At December 31, 2012 and 2011, the Company’s Consolidated Balance Sheets did not include
$1.8 billion and $2.0 billion, respectively, of estimated assets and $1.7 billion and $1.9 billion, respectively, of
estimated liabilities. The Company is not obligated to provide any support to these entities, nor has it previously
provided support to these entities. No events occurred during the year ended December 31, 2012, that would change
the Company’s previous conclusion that it is not the primary beneficiary of any of these securitization entities.
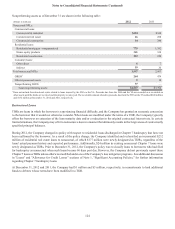
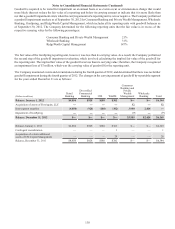
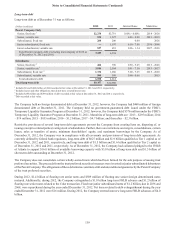
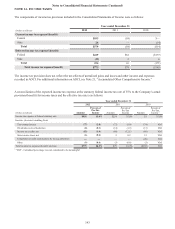
Student Loans
During 2006, the Company completed a securitization of government-guaranteed student loans through a transfer of
loans to a securitization SPE, which previously qualified as a QSPE, and retained the related residual interest in the
SPE. The Company concluded that this securitization of government-guaranteed student loans (the “Student Loan
entity”) should be consolidated. At December 31, 2012 and 2011, the Company’s Consolidated Balance Sheets
reflected $384 million and $438 million, respectively, of assets held by the Student Loan entity and $380 million and
$433 million, respectively, of debt issued by the Student Loan entity.
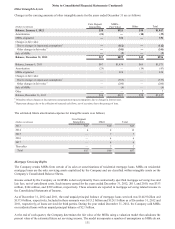
Payments from the assets in the SPE must first be used to settle the obligations of the SPE, with any remaining
payments remitted to the Company as the owner of the residual interest. To the extent that losses occur on the SPE’s
assets, the SPE has recourse to the federal government as the guarantor up to a maximum guarantee amount of 97%.
Losses in excess of the government guarantee reduce the amount of available cash payable to the Company as the
owner of the residual interest. To the extent that losses result from a breach of the master servicer’s servicing
responsibilities, the SPE has recourse to the Company; the SPE may require the Company to repurchase the loan
from the SPE at par value. If the breach was caused by the subservicer, the Company has recourse to seek
reimbursement from the subservicer up to the guaranteed amount. The Company’s maximum exposure to loss related
to the SPE is represented by the potential losses resulting from a breach of servicing responsibilities. To date, all loss
claims filed with the guarantor that have been denied due to servicing errors have either been cured or reimbursement
has been provided to the Company by the subservicer.
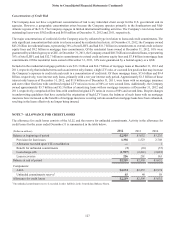
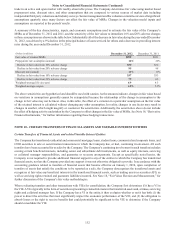
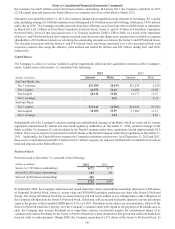
CDO Securities
The Company has transferred bank trust preferred securities in securitization transactions. The Company is not
obligated to provide any support to these entities and its maximum exposure to loss at December 31, 2012 and 2011,
includes current senior interests held in trading securities, which have fair values of $52 million and $43 million,
respectively.
As discussed further in Note 18, "Fair Value Election and Measurement," the Company values these interests by
constructing a pricing matrix of values based on a range of overcollateralization levels that are derived from discussions
with the dealer community along with limited trade data. The price derived from the matrix is then adjusted for each
security based on deal specific factors such as the percentage of collateral that is considered to be at heightened risk
for future deferral or default, and collateral specific prepayment expectations, among other factors. The underlying
collateral of the VIEs is highly concentrated, and as a result, the default or deferral of certain large exposures adversely
impacts the value of the interests. From a sensitivity analysis of the overcollateralization, the Company estimates
that if each of the VIEs in which the Company holds retained positions experienced one to three additional large
deferrals or defaults of an underlying collateral obligation, the fair value of the retained ARS would decline $7 million
to $19 million, respectively.
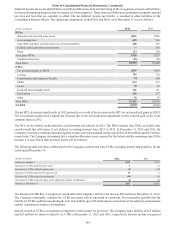
At December 31, 2012 and 2011, the total assets of the trust preferred CDO entities in which the Company has
remaining exposure to loss were $1.2 billion. The Company determined that it was not the primary beneficiary of
any of these VIEs as the Company lacks the power to direct the significant activities of any of the VIEs. No events
occurred during the year ended December 31, 2012 , that changed either the Company’s sale accounting or the
Company’s conclusions that it is not the primary beneficiary of these VIEs.