SunTrust 2012 Annual Report Download - page 59
Download and view the complete annual report
Please find page 59 of the 2012 SunTrust annual report below. You can navigate through the pages in the report by either clicking on the pages listed below, or by using the keyword search tool below to find specific information within the annual report.-
 1
1 -
2
-
3
-
4
-
5
-
6
-
7
-
8
-
9
-
10
-
11
-
12
-
13
-
14
-
15
-
16
-
17
-
18
-
19
-
20
-
21
-
22
-
23
-
24
-
25
-
26
-
27
-
28
-
29
-
30
-
31
-
32
-
33
-
34
-
35
-
36
-
37
-
38
-
39
-
40
-
41
-
42
-
43
-
44
-
45
-
46
-
47
-
48
-
 49
49 -
 50
50 -
 51
51 -
 52
52 -
 53
53 -
 54
54 -
 55
55 -
 56
56 -
 57
57 -
 58
58 -
 59
59 -
 60
60 -
 61
61 -
 62
62 -
 63
63 -
 64
64 -
 65
65 -
 66
66 -
 67
67 -
 68
68 -
 69
69 -
70
-
71
-
72
-
73
-
74
-
75
-
76
-
77
-
78
-
79
-
80
-
81
-
82
-
83
-
84
-
85
-
86
-
87
-
88
-
89
-
90
-
91
-
92
-
93
-
94
-
95
-
96
-
97
-
98
-
99
-
100
-
101
-
102
-
103
-
104
-
105
-
106
-
107
-
108
-
109
-
110
-
111
-
112
-
113
-
114
-
115
-
116
-
117
-
118
-
119
-
120
-
121
-
122
-
123
-
124
-
125
-
126
-
127
-
128
-
129
-
130
-
131
-
132
-
133
-
134
-
135
-
136
-
137
-
138
-
139
-
140
-
141
-
142
-
143
-
144
-
145
-
146
-
147
-
148
-
149
-
150
-
151
-
152
-
153
-
154
-
155
-
156
-
157
-
158
-
159
-
160
-
161
-
162
-
163
-
164
-
165
-
166
-
167
-
168
-
169
-
170
-
171
-
172
-
173
-
174
-
175
-
176
-
177
-
178
-
179
-
180
-
181
-
182
-
183
-
184
-
185
-
186
-
187
-
188
-
189
-
190
-
191
-
192
-
193
-
194
-
195
-
196
-
197
-
198
-
199
-
200
-
201
-
202
-
203
-
204
-
205
-
206
-
207
-
208
-
209
-
210
-
211
-
212
-
213
-
214
-
215
-
216
-
217
-
218
-
219
-
220
-
221
-
222
-
223
-
224
-
225
-
226
-
227
-
228
 |
 |
43
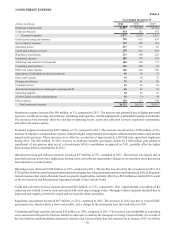
longer be required to incur the consulting and legal costs of the independent third parties providing file review, borrower
outreach, and legal services associated with the Consent Order foreclosure file review. The consulting and legal costs associated
with the foreclosure file review have been approximately $10 million to $20 million per quarter, and are expected to decline
significantly beginning in the first quarter of 2013. However, we continue to incur regulatory required consulting and legal
costs. For example, we may incur additional consulting and legal costs in the future associated with new regulatory
requirements related to Consent Order remediation activities, National Servicing Settlement monitoring and oversight, and
CFPB directives. For additional information regarding the Consent Order, see Note 19, “Contingencies,” to the Consolidated
Financial Statements in this Form 10-K and the “Nonperforming Assets” section of this MD&A.
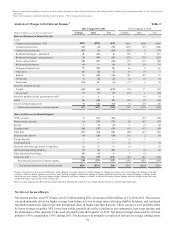
Other real estate expense decreased $124 million, or 47%, compared to 2011. The decrease was predominantly due to a decline
in the OREO inventory resulting in lower loss provisioning, combined with a decrease in losses on sales of owned properties.
Over time, as the economic environment improves, we expect that other real estate expense will continue to improve, but will
likely remain elevated compared with the levels realized prior to the economic recession.
Affordable housing impairment increased $86 million compared to 2011, driven by a $96 million write-down recognized in
the third quarter of 2012, upon the decision to market certain affordable housing investments for sale. One of these consolidated
affordable housing properties was sold as of December 31, 2012 at an immaterial gain. For the remaining $0.1 billion of
properties, marketing efforts continue as scheduled, and it is anticipated that the properties will be sold in 2013. There was
no additional valuation adjustment required in the fourth quarter of 2012.
Net loss on debt extinguishment increased by $19 million compared to 2011, due to the $13 million non-cash charges associated
with the redemption of higher cost trust preferred securities.
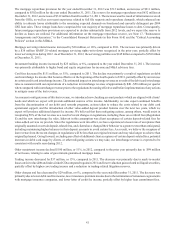
PROVISION FOR INCOME TAXES
The provision for income taxes includes both federal and state income taxes. For the year ended December 31, 2012, the
provision for income taxes was $773 million, resulting in an effective tax rate of 28.3%. For the year ended December 31,
2011, the provision for income taxes was $79 million, resulting in an effective tax rate of 10.9%. The provision for income
taxes differs from the provision using statutory rates primarily due to favorable permanent tax items such as income from
lending to tax exempt entities and federal tax credits from community reinvestment activities. The increase in the effective
tax rate for the year ended December 31, 2012, was primarily due to higher pre-tax earnings. See additional discussion related
to the provision for income taxes in Note 14, “Income Taxes,” to the Consolidated Financial Statements in this Form 10-K.
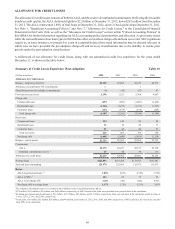
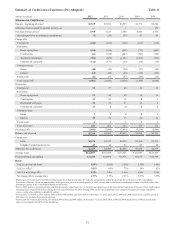
LOANS
Our disclosures about the credit quality of our loan portfolios and the related credit reserves 1) describe the nature of credit
risk inherent in our loan portfolio, 2) provide information on how we analyze and assess credit risk in arriving at an adequate
and appropriate ALLL, and 3) explain the changes in the ALLL and reasons for those changes. We disclose our loan portfolio
by segment and/or by type of loan, which is the level at which we develop and document our method for determining our
ALLL. Loan types are further categorizations of our portfolio segments. Our current loan portfolio segments were defined in
2010 in conjunction with adopting newly issued accounting guidance; therefore, we adjusted 2009 loan classifications to align
with post-adoption loan classifications but were not able to conform 2008 loan classifications. SEC regulations require us, in
some instances, to present five years of comparable data where trend information may be deemed relevant, in which case we
have provided the pre-adoption loan classifications.
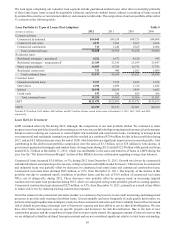
We report our loan portfolio in three segments: commercial, residential, and consumer. Loans are assigned to these segments
based upon the type of borrower, collateral, and/or our underlying credit management processes. Additionally, within each
segment, we have identified loan types, which further disaggregate loans based upon common risk characteristics.
The commercial and industrial loan type includes loans secured by owner-occupied properties, corporate credit cards, and
other wholesale lending activities. Commercial real estate and commercial construction loan types are based on investor
exposures where repayment is largely dependent upon the operation, refinance, or sale of the underlying real estate. Commercial
and construction loans secured by owner-occupied properties are classified as commercial and industrial loans, as the primary
source of loan repayment for owner-occupied properties is business income and not real estate operations.
Residential mortgages consist of loans secured by 1-4 family homes, mostly prime first-lien loans, both guaranteed and
nonguaranteed. Residential construction loans include residential lot loans and construction-to-perm loans. Home equity
products consist of equity lines of credit and closed-end equity loans that may be in either a first lien or second lien position.