SunTrust 2012 Annual Report Download - page 119
Download and view the complete annual report
Please find page 119 of the 2012 SunTrust annual report below. You can navigate through the pages in the report by either clicking on the pages listed below, or by using the keyword search tool below to find specific information within the annual report.-
 1
1 -
2
-
3
-
4
-
5
-
6
-
7
-
8
-
9
-
10
-
11
-
12
-
13
-
14
-
15
-
16
-
17
-
18
-
19
-
20
-
21
-
22
-
23
-
24
-
25
-
26
-
27
-
28
-
29
-
30
-
31
-
32
-
33
-
34
-
35
-
36
-
37
-
38
-
39
-
40
-
41
-
42
-
43
-
44
-
45
-
46
-
47
-
48
-
49
-
50
-
51
-
52
-
53
-
54
-
55
-
56
-
57
-
58
-
59
-
60
-
61
-
62
-
63
-
64
-
65
-
66
-
67
-
68
-
69
-
70
-
71
-
72
-
73
-
74
-
75
-
76
-
77
-
78
-
79
-
80
-
81
-
82
-
83
-
84
-
85
-
86
-
87
-
88
-
89
-
90
-
91
-
92
-
93
-
94
-
95
-
96
-
97
-
98
-
99
-
100
-
101
-
102
-
103
-
104
-
105
-
106
-
107
-
108
-
 109
109 -
 110
110 -
 111
111 -
 112
112 -
 113
113 -
 114
114 -
 115
115 -
 116
116 -
 117
117 -
 118
118 -
 119
119 -
 120
120 -
 121
121 -
 122
122 -
 123
123 -
 124
124 -
 125
125 -
 126
126 -
 127
127 -
 128
128 -
 129
129 -
130
-
131
-
132
-
133
-
134
-
135
-
136
-
137
-
138
-
139
-
140
-
141
-
142
-
143
-
144
-
145
-
146
-
147
-
148
-
149
-
150
-
151
-
152
-
153
-
154
-
155
-
156
-
157
-
158
-
159
-
160
-
161
-
162
-
163
-
164
-
165
-
166
-
167
-
168
-
169
-
170
-
171
-
172
-
173
-
174
-
175
-
176
-
177
-
178
-
179
-
180
-
181
-
182
-
183
-
184
-
185
-
186
-
187
-
188
-
189
-
190
-
191
-
192
-
193
-
194
-
195
-
196
-
197
-
198
-
199
-
200
-
201
-
202
-
203
-
204
-
205
-
206
-
207
-
208
-
209
-
210
-
211
-
212
-
213
-
214
-
215
-
216
-
217
-
218
-
219
-
220
-
221
-
222
-
223
-
224
-
225
-
226
-
227
-
228
 |
 |

103
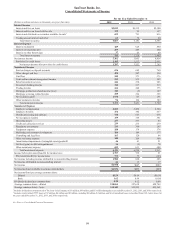
SunTrust Banks, Inc.
Consolidated Statements of Cash Flows
Year Ended December 31
(Dollars in millions) 2012 2011 2010
Cash Flows from Operating Activities
Net income including income attributable to noncontrolling interest $1,984 $660 $206
Adjustments to reconcile net income to net cash provided by operating activities:
Depreciation, amortization, and accretion 757 760 803
Goodwill impairment 7— —
Origination of mortgage servicing rights (336) (224) (289)
Provisions for credit losses and foreclosed property 1,535 1,664 2,831
Mortgage repurchase provision 713 502 456
Deferred income tax expense/(benefit) 194 83 (171)
Stock option compensation and amortization of restricted stock compensation 35 44 66
Net loss/(gain) on extinguishment of debt 16 (3) 70
Net securities gains (1,974) (117) (191)
Net gain on sale of loans held for sale, loans, and other assets (1,063) (408) (597)
Gain on pension curtailment —(88) —
Net decrease in loans held for sale 194 2,234 1,003
Net decrease/(increase) in other assets 974 (497) (341)
Net (decrease)/increase in other liabilities (1,026) 18 372
Net cash provided by operating activities 2,010 4,628 4,218
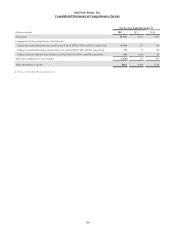
Cash Flows from Investing Activities
Proceeds from maturities, calls, and paydowns of securities available for sale 7,371 5,557 5,597
Proceeds from sales of securities available for sale 4,300 12,557 17,465
Purchases of securities available for sale (5,814) (18,872) (20,920)
Proceeds from maturities, calls, and paydowns of trading securities 3139 99
Proceeds from sales of trading securities —102 132
Net increase in loans, including purchases of loans (6,400) (11,034) (4,566)
Proceeds from sales of loans 4,916 747 936
Capital expenditures (206) (131) (252)
Payments related to acquisitions, including contingent consideration (12) (24) (10)
Proceeds from the sale of other real estate owned and other assets 585 628 800
Net cash provided by/(used in) investing activities 4,743 (10,331) (719)
Cash Flows from Financing Activities
Net increase in total deposits 4,394 4,878 1,182
Net (decrease)/increase in funds purchased, securities sold under agreements
to repurchase, and other short-term borrowings (5,972) 6,650 (1,295)
Proceeds from the issuance of long-term debt 4,000 1,749 500
Repayment of long-term debt (5,772) (4,571) (5,246)
Proceeds from the issuance of common stock —1,017 —
Proceeds from the issuance of preferred stock 438 103 —
Repurchase of preferred stock —(4,850) —
Purchase of outstanding warrants —(11) —
Common and preferred dividends paid (119) (131) (259)
Stock option activity 26 — —
Net cash (used in)/provided by financing activities (3,005) 4,834 (5,118)
Net increase/(decrease) in cash and cash equivalents 3,748 (869) (1,619)
Cash and cash equivalents at beginning of period 4,509 5,378 6,997
Cash and cash equivalents at end of period $8,257 $4,509 $5,378
Supplemental Disclosures:
Interest paid $774 $1,138 $1,537
Income taxes paid 607 68 33
Income taxes refunded (1) (1) (435)
Loans transferred from loans held for sale to loans 71 63 213
Loans transferred from loans to loans held for sale 3,695 754 346
Loans transferred from loans and loans held for sale to other real estate owned 399 725 1,063
Amortization of deferred gain on sale/leaseback of premises 67 59 59
Accretion of discount for preferred stock issued to the U.S. Treasury —80 25
Total assets of newly consolidated VIEs during 2010 —— 2,541
See Notes to Consolidated Financial Statements.