SunTrust 2012 Annual Report Download - page 196
Download and view the complete annual report
Please find page 196 of the 2012 SunTrust annual report below. You can navigate through the pages in the report by either clicking on the pages listed below, or by using the keyword search tool below to find specific information within the annual report.-
 1
1 -
2
-
3
-
4
-
5
-
6
-
7
-
8
-
9
-
10
-
11
-
12
-
13
-
14
-
15
-
16
-
17
-
18
-
19
-
20
-
21
-
22
-
23
-
24
-
25
-
26
-
27
-
28
-
29
-
30
-
31
-
32
-
33
-
34
-
35
-
36
-
37
-
38
-
39
-
40
-
41
-
42
-
43
-
44
-
45
-
46
-
47
-
48
-
49
-
50
-
51
-
52
-
53
-
54
-
55
-
56
-
57
-
58
-
59
-
60
-
61
-
62
-
63
-
64
-
65
-
66
-
67
-
68
-
69
-
70
-
71
-
72
-
73
-
74
-
75
-
76
-
77
-
78
-
79
-
80
-
81
-
82
-
83
-
84
-
85
-
86
-
87
-
88
-
89
-
90
-
91
-
92
-
93
-
94
-
95
-
96
-
97
-
98
-
99
-
100
-
101
-
102
-
103
-
104
-
105
-
106
-
107
-
108
-
109
-
110
-
111
-
112
-
113
-
114
-
115
-
116
-
117
-
118
-
119
-
120
-
121
-
122
-
123
-
124
-
125
-
126
-
127
-
128
-
129
-
130
-
131
-
132
-
133
-
134
-
135
-
136
-
137
-
138
-
139
-
140
-
141
-
142
-
143
-
144
-
145
-
146
-
147
-
148
-
149
-
150
-
151
-
152
-
153
-
154
-
155
-
156
-
157
-
158
-
159
-
160
-
161
-
162
-
163
-
164
-
165
-
166
-
167
-
168
-
169
-
170
-
171
-
172
-
173
-
174
-
175
-
176
-
177
-
178
-
179
-
180
-
181
-
182
-
183
-
184
-
185
-
 186
186 -
 187
187 -
 188
188 -
 189
189 -
 190
190 -
 191
191 -
 192
192 -
 193
193 -
 194
194 -
 195
195 -
 196
196 -
 197
197 -
 198
198 -
 199
199 -
 200
200 -
 201
201 -
 202
202 -
 203
203 -
 204
204 -
 205
205 -
 206
206 -
207
-
208
-
209
-
210
-
211
-
212
-
213
-
214
-
215
-
216
-
217
-
218
-
219
-
220
-
221
-
222
-
223
-
224
-
225
-
226
-
227
-
228
 |
 |

Notes to Consolidated Financial Statements (Continued)
180
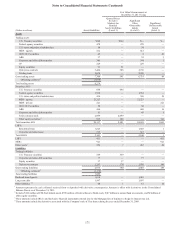
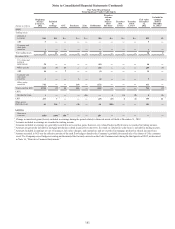
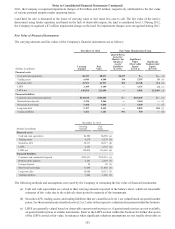
The valuation technique and range, including weighted average, of the unobservable inputs associated with the Company's
level 3 assets and liabilities are as follows:
Level 3 Significant Unobservable Input Assumptions
(Dollars in millions)
Fair value
December 31,
2012 Valuation Technique Unobservable Input1Range
(weighted average)
Assets:
Trading assets:
CDO/CLO securities $52 Matrix pricing Indicative pricing based on
overcollateralization ratio $33-$45 ($40)
Estimated collateral losses 34-45% (39%)
ABS 5 Matrix pricing Indicative pricing $45 ($45)
Corporate and other debt securities 1 Third party pricing N/A
Securities AFS:
U.S. states and political subdivisions 46 Matrix pricing Indicative pricing $72-$115 ($92)
MBS - private 209 Third party pricing N/A
ABS 21 Third party pricing N/A
Corporate and other debt securities 5 Cost N/A
Other equity securities 633 Cost N/A
Residential LHFS 8 Monte Carlo/Discounted
cash flow
Option adjusted spread 0-622 bps (251 bps)
Conditional prepayment rate 5-30 CPR (15 CPR)
Conditional default rate 0-20 CDR (3.5 CDR)
LHFI 369 Monte Carlo/Discounted
cash flow
Option adjusted spread 0-622 bps (251 bps)
Conditional prepayment rate 5-30 CPR (15 CPR)
Conditional default rate 0-20 CDR (3.5 CDR)
10 Collateral based pricing Appraised value NM2
MSRs 899 Discounted cash flow Conditional prepayment rate 6-31 CPR (16 CPR)
Discount rate 9-28% (11%)
Other assets/(liabilities), net3132 Internal model Pull through rate 9-98% (71%)
MSR value 6-244 bps (104 bps)
(24) Internal model Loan production volume 0-150% (92%)
(7) Internal model Revenue run rate NM2
1 For certain assets and liabilities that the Company utilizes third party pricing, the unobservable inputs and their ranges are not reasonably available to the
Company, and therefore, have been noted as "N/A."
2 Not meaningful.
3 Input assumptions relate to the Company's IRLCs and the contingent consideration obligations related to acquisitions. Refer to Note 17, "Reinsurance
Arrangements and Guarantees," for additional information.
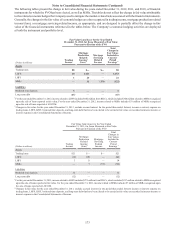
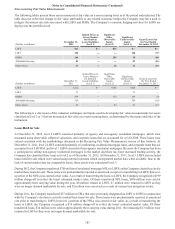
The following tables present a reconciliation of the beginning and ending balances for fair valued assets and liabilities measured
on a recurring basis using significant unobservable inputs (other than MSRs which are disclosed in Note 9, “Goodwill and
Other Intangible Assets”). Transfers into and out of the fair value hierarchy levels are assumed to be as of the end of the quarter
in which the transfer occurred. None of the transfers into or out of level 3 have been the result of using alternative valuation
approaches to estimate fair values. There were no transfers between level 1 and 2 during the years ended December 31, 2012
and 2011.