SunTrust 2012 Annual Report Download - page 110
Download and view the complete annual report
Please find page 110 of the 2012 SunTrust annual report below. You can navigate through the pages in the report by either clicking on the pages listed below, or by using the keyword search tool below to find specific information within the annual report.-
 1
1 -
2
-
3
-
4
-
5
-
6
-
7
-
8
-
9
-
10
-
11
-
12
-
13
-
14
-
15
-
16
-
17
-
18
-
19
-
20
-
21
-
22
-
23
-
24
-
25
-
26
-
27
-
28
-
29
-
30
-
31
-
32
-
33
-
34
-
35
-
36
-
37
-
38
-
39
-
40
-
41
-
42
-
43
-
44
-
45
-
46
-
47
-
48
-
49
-
50
-
51
-
52
-
53
-
54
-
55
-
56
-
57
-
58
-
59
-
60
-
61
-
62
-
63
-
64
-
65
-
66
-
67
-
68
-
69
-
70
-
71
-
72
-
73
-
74
-
75
-
76
-
77
-
78
-
79
-
80
-
81
-
82
-
83
-
84
-
85
-
86
-
87
-
88
-
89
-
90
-
91
-
92
-
93
-
94
-
95
-
96
-
97
-
98
-
99
-
 100
100 -
 101
101 -
 102
102 -
 103
103 -
 104
104 -
 105
105 -
 106
106 -
 107
107 -
 108
108 -
 109
109 -
 110
110 -
 111
111 -
 112
112 -
 113
113 -
 114
114 -
 115
115 -
 116
116 -
 117
117 -
 118
118 -
 119
119 -
 120
120 -
121
-
122
-
123
-
124
-
125
-
126
-
127
-
128
-
129
-
130
-
131
-
132
-
133
-
134
-
135
-
136
-
137
-
138
-
139
-
140
-
141
-
142
-
143
-
144
-
145
-
146
-
147
-
148
-
149
-
150
-
151
-
152
-
153
-
154
-
155
-
156
-
157
-
158
-
159
-
160
-
161
-
162
-
163
-
164
-
165
-
166
-
167
-
168
-
169
-
170
-
171
-
172
-
173
-
174
-
175
-
176
-
177
-
178
-
179
-
180
-
181
-
182
-
183
-
184
-
185
-
186
-
187
-
188
-
189
-
190
-
191
-
192
-
193
-
194
-
195
-
196
-
197
-
198
-
199
-
200
-
201
-
202
-
203
-
204
-
205
-
206
-
207
-
208
-
209
-
210
-
211
-
212
-
213
-
214
-
215
-
216
-
217
-
218
-
219
-
220
-
221
-
222
-
223
-
224
-
225
-
226
-
227
-
228
 |
 |

94
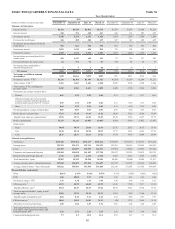
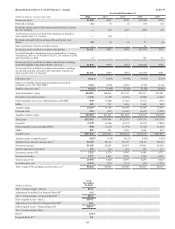
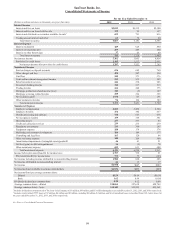
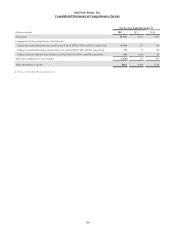
Reconcilement of Non-U.S. GAAP Measures – Annual, continued
(Dollars in millions)
For the year ended
December 31, 2012
Net income available to common shareholders $1,931
Gains on sale of Coke common stock (1,239)
Coke stock contribution expense 24
Losses on sales of loans and write-down of certain affordable
housing investments being marketed for sale 236
Mortgage repurchase provision on GSE loans 226
Net income available to common shareholders, excluding strategic
actions12 $1,178
For the year ended
December 31, 2012
(Dollars in millions) Income Expense
Net interest income - FTE $5,225 $—
Noninterest income/noninterest expense 5,373 6,323
Gains on sale of Coke common stock (1,938) —
Coke stock contribution expense — (38)
Losses on sales of loans and write-down of certain affordable
housing investments being marketed for sale 92 (96)
Mortgage repurchase provision on GSE loans 371 —
Impairment/amortization of goodwill/intangible assets — (46)
Revenue - FTE/noninterest expense, excluding the impact of
strategic actions and impairment/amortization of goodwill/
intangible assets13 $9,123 $6,143
Efficiency ratio 259.67%
Impact of excluding impairment/amortization of goodwill/
intangible assets other than MSRs (0.43)
Tangible efficiency ratio 359.24
Impact of excluding gains on sale of Coke common stock 13.24
Impact of excluding Coke stock contribution expense (0.37)
Impact of excluding losses on sales of loans and write-down of
certain affordable housing investments being marketed for sale (1.42)
Impact of excluding mortgage repurchase provision on GSE loans (3.34)
Adjusted tangible efficiency ratio13 67.35%
ROA 1.11%
Impact of excluding gains on sale of Coke common stock (0.70)
Impact of excluding Coke stock contribution expense 0.01
Impact of excluding losses on sales of loans and write-down of
certain affordable housing investments being marketed for sale 0.13
Impact of excluding mortgage repurchase provision on GSE loans 0.13
Adjusted ROA14 0.68%
Net income/(loss) per average common share, diluted $3.59
Impact of excluding gains on sale of Coke common stock (2.30)
Impact of excluding Coke stock contribution expense 0.04
Impact of excluding losses on sales of loans and write-down of
certain affordable housing investments being marketed for sale 0.44
Impact of excluding mortgage repurchase provision on GSE loans 0.42
Adjusted net income/(loss) per average common share, diluted 12, 15 $2.19
1We present net income/(loss) available to common shareholders that excludes the portion of the impairment charges on goodwill and intangible assets allocated to the common
shareholders and net income/(loss) to common shareholders that excludes the accelerated accretion associated with the repurchase of preferred stock issued to the U.S. Treasury.
We believe these measures are useful to investors, because removing the non-cash impairment charge and non-cash accelerated accretion provides a more representative view of
normalized operations and the measure also allows better comparability with peers in the industry who also provide a similar presentation when applicable. In addition, we use
this measure internally to analyze performance.
2Computed by dividing noninterest expense by total revenue - FTE. The FTE basis adjusts for the tax-favored status of net interest income from certain loans and investments.
We believe this measure to be the preferred industry measurement of net interest income and it enhances comparability of net interest income arising from taxable and tax-
exempt sources.