SunTrust 2012 Annual Report Download - page 199
Download and view the complete annual report
Please find page 199 of the 2012 SunTrust annual report below. You can navigate through the pages in the report by either clicking on the pages listed below, or by using the keyword search tool below to find specific information within the annual report.-
 1
1 -
2
-
3
-
4
-
5
-
6
-
7
-
8
-
9
-
10
-
11
-
12
-
13
-
14
-
15
-
16
-
17
-
18
-
19
-
20
-
21
-
22
-
23
-
24
-
25
-
26
-
27
-
28
-
29
-
30
-
31
-
32
-
33
-
34
-
35
-
36
-
37
-
38
-
39
-
40
-
41
-
42
-
43
-
44
-
45
-
46
-
47
-
48
-
49
-
50
-
51
-
52
-
53
-
54
-
55
-
56
-
57
-
58
-
59
-
60
-
61
-
62
-
63
-
64
-
65
-
66
-
67
-
68
-
69
-
70
-
71
-
72
-
73
-
74
-
75
-
76
-
77
-
78
-
79
-
80
-
81
-
82
-
83
-
84
-
85
-
86
-
87
-
88
-
89
-
90
-
91
-
92
-
93
-
94
-
95
-
96
-
97
-
98
-
99
-
100
-
101
-
102
-
103
-
104
-
105
-
106
-
107
-
108
-
109
-
110
-
111
-
112
-
113
-
114
-
115
-
116
-
117
-
118
-
119
-
120
-
121
-
122
-
123
-
124
-
125
-
126
-
127
-
128
-
129
-
130
-
131
-
132
-
133
-
134
-
135
-
136
-
137
-
138
-
139
-
140
-
141
-
142
-
143
-
144
-
145
-
146
-
147
-
148
-
149
-
150
-
151
-
152
-
153
-
154
-
155
-
156
-
157
-
158
-
159
-
160
-
161
-
162
-
163
-
164
-
165
-
166
-
167
-
168
-
169
-
170
-
171
-
172
-
173
-
174
-
175
-
176
-
177
-
178
-
179
-
180
-
181
-
182
-
183
-
184
-
185
-
186
-
187
-
188
-
 189
189 -
 190
190 -
 191
191 -
 192
192 -
 193
193 -
 194
194 -
 195
195 -
 196
196 -
 197
197 -
 198
198 -
 199
199 -
 200
200 -
 201
201 -
 202
202 -
 203
203 -
 204
204 -
 205
205 -
 206
206 -
 207
207 -
 208
208 -
 209
209 -
210
-
211
-
212
-
213
-
214
-
215
-
216
-
217
-
218
-
219
-
220
-
221
-
222
-
223
-
224
-
225
-
226
-
227
-
228
 |
 |
Notes to Consolidated Financial Statements (Continued)
183
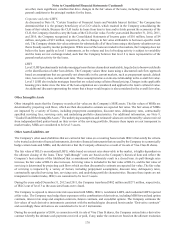
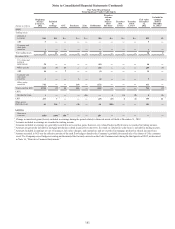
Non-recurring Fair Value Measurements
The following tables present those assets measured at fair value on a non-recurring basis as of the period end indicated. The
table does not reflect the change in fair value attributable to any related economic hedges the Company may have used to
mitigate the interest rate risk associated with LHFS and MSRs. The Company’ s economic hedging activities for LHFS are
deployed at the portfolio level.
(Dollars in millions) December 31,
2012
Quoted Prices in
Active Markets
for Identical
Assets/Liabilities
(Level 1)
Significant
Other
Observable
Inputs
(Level 2)
Significant
Unobservable
Inputs
(Level 3)
Gains/(Losses) for
the Year Ended
December 31, 2012
LHFS $65 $— $65 $— $—
LHFI 308 — — 308 (79)
OREO 264 — 205 59 (48)
Affordable Housing 82 — — 82 (96)
Other Assets 65 — 42 23 (13)
(Dollars in millions)
December 31,
2011
Quoted Prices in
Active Markets
for Identical
Assets/Liabilities
(Level 1)
Significant
Other
Observable
Inputs
(Level 2)
Significant
Unobservable
Inputs
(Level 3)
Gains/(Losses) for
the Year Ended
December 31, 2011
LHFS $212 $— $108 $104 $—
LHFI 72 — — 72 —
OREO 479 — 372 107 (9)
Affordable Housing 324 — — 324 (10)
Other Assets 45 — 24 21 (17)
The following is a discussion of the valuation techniques and inputs used in developing fair value measurements for assets
classified as level 2 or 3 that are measured at fair value on a non-recurring basis, as determined by the nature and risks of the
instrument.
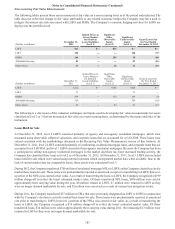
Loans Held for Sale
At December 31, 2012, level 2 LHFS consisted primarily of agency and non-agency residential mortgages, which were
measured using observable collateral valuations, and corporate loans that are accounted for at LOCOM. These loans were
valued consistent with the methodology discussed in the Recurring Fair Value Measurement section of this footnote. At
December 31, 2011, level 2 LHFS consisted primarily of conforming, residential mortgage loans, and corporate loans that are
accounted for at LOCOM, and level 3 LHFS consisted of non-agency residential mortgages. Because the Company has been
a participant in selling non-agency residential mortgages in the market and there has been increased trading activity, the
Company has classified these loans as level 2 as of December 31, 2012. At December 31, 2011, level 3 LHFS also included
leases held for sale which were valued using internal estimates which incorporated market data when available. Due to the
lack of current market data for comparable leases, these assets were considered level 3.
During 2012, the Company transferred $700 million of residential mortgage NPLs to LHFS, as the Company elected to actively
market these loans for sale. These loans were predominantly reported at amortized cost prior to transferring to LHFS; however,
a portion of the NPLs was carried at fair value. As a result of transferring the loans to LHFS, the Company recognized a $199
million charge-off to reflect the loans' estimated market value. Of these transferred NPL loans, $486 million were sold at
approximately their carrying value during the year, $6 million remain in LHFS, $7 million were returned to LHFI as they
were no longer deemed marketable for sale, and $2 million were removed as a result of various loss mitigation events.
During 2011, the Company transferred $57 million in NPLs that were previously designated as LHFI to LHFS in conjunction
with the Company’s election to actively market these loans for sale. These loans were predominantly reported at amortized
cost prior to transferring to LHFS; however, a portion of the NPLs was carried at fair value. As a result of transferring the
loans to LHFS, the Company recognized a $10 million charge-off to reflect the loans' estimated market value. Of these
transferred loans, $34 million were sold at approximately their carrying value during 2011; the remaining $13 million were
returned to LHFI as they were no longer deemed marketable for sale.