SunTrust 2012 Annual Report Download - page 55
Download and view the complete annual report
Please find page 55 of the 2012 SunTrust annual report below. You can navigate through the pages in the report by either clicking on the pages listed below, or by using the keyword search tool below to find specific information within the annual report.-
 1
1 -
2
-
3
-
4
-
5
-
6
-
7
-
8
-
9
-
10
-
11
-
12
-
13
-
14
-
15
-
16
-
17
-
18
-
19
-
20
-
21
-
22
-
23
-
24
-
25
-
26
-
27
-
28
-
29
-
30
-
31
-
32
-
33
-
34
-
35
-
36
-
37
-
38
-
39
-
40
-
41
-
42
-
43
-
44
-
 45
45 -
 46
46 -
 47
47 -
 48
48 -
 49
49 -
 50
50 -
 51
51 -
 52
52 -
 53
53 -
 54
54 -
 55
55 -
 56
56 -
 57
57 -
 58
58 -
 59
59 -
 60
60 -
 61
61 -
 62
62 -
 63
63 -
 64
64 -
 65
65 -
66
-
67
-
68
-
69
-
70
-
71
-
72
-
73
-
74
-
75
-
76
-
77
-
78
-
79
-
80
-
81
-
82
-
83
-
84
-
85
-
86
-
87
-
88
-
89
-
90
-
91
-
92
-
93
-
94
-
95
-
96
-
97
-
98
-
99
-
100
-
101
-
102
-
103
-
104
-
105
-
106
-
107
-
108
-
109
-
110
-
111
-
112
-
113
-
114
-
115
-
116
-
117
-
118
-
119
-
120
-
121
-
122
-
123
-
124
-
125
-
126
-
127
-
128
-
129
-
130
-
131
-
132
-
133
-
134
-
135
-
136
-
137
-
138
-
139
-
140
-
141
-
142
-
143
-
144
-
145
-
146
-
147
-
148
-
149
-
150
-
151
-
152
-
153
-
154
-
155
-
156
-
157
-
158
-
159
-
160
-
161
-
162
-
163
-
164
-
165
-
166
-
167
-
168
-
169
-
170
-
171
-
172
-
173
-
174
-
175
-
176
-
177
-
178
-
179
-
180
-
181
-
182
-
183
-
184
-
185
-
186
-
187
-
188
-
189
-
190
-
191
-
192
-
193
-
194
-
195
-
196
-
197
-
198
-
199
-
200
-
201
-
202
-
203
-
204
-
205
-
206
-
207
-
208
-
209
-
210
-
211
-
212
-
213
-
214
-
215
-
216
-
217
-
218
-
219
-
220
-
221
-
222
-
223
-
224
-
225
-
226
-
227
-
228
 |
 |

39
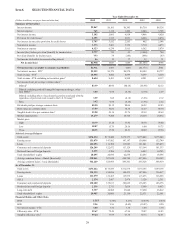
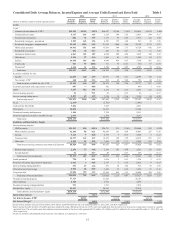
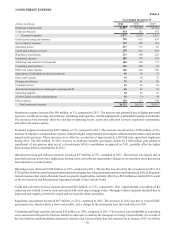
at marginally lower yields, the decline in our swap income, and the foregone Coke dividend income, partially offset by lower
rates paid on interest-bearing liabilities and the redemptions of the higher cost trust preferred securities. Yields on earning
assets declined by 36 basis points to 3.90% during 2012, compared to 4.26% during 2011, as loans added during the year
yielded less than maturing loans, reflecting the current low interest rate environment. Additionally, loan yields during 2012
were impacted by a decline in income derived from interest rate swaps utilized to manage interest rate risk. In the first quarter
of 2013, we expect a modest reduction to net interest income as a result of our smaller balance sheet due to loan sales completed
during the fourth quarter of 2012. Furthermore, we anticipate a modest reduction in the net interest margin in the first quarter
of 2013, driven by additional reductions in asset yields, which we expect will partially be offset by lower liability costs.
Average earning assets increased by $5.7 billion, or 4%, compared to 2011. The increase was predominantly due to the growth
in average loans, which increased by $6.6 billion, or 6%. Average LHFS increased $1.0 billion, or 45%, as a result of the
transfer of $3.7 billion of LHFI to LHFS during the year and higher closed mortgage loan volume. Partially offsetting the
increases in average loans was a $2.2 billion, or 9%, decrease in our average securities AFS portfolio, which was the result
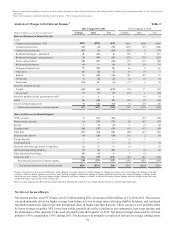
of prepayments, maturities, and principal repayments. The increase in average loans was predominantly a result of growth
in commercial and industrial loans, primarily driven by our large corporate and middle market borrowers, government-
guaranteed student loans, guaranteed residential mortgages, consumer-indirect loans, high credit quality nonguaranteed
residential mortgages, and other direct consumer loans. These increases were partially offset by declines in nonaccrual loans,
home equity products, commercial real estate loans, and commercial construction loans. The declines in home equity,
commercial real estate, and commercial construction loans predominantly resulted from our targeted efforts to reduce exposure
to these higher-risk loans. Our loan portfolio yielded 4.19% during 2012, down 39 basis points from 2011. The yield decline
was primarily driven by the low interest rate environment and the lower swap-related income impacting commercial loan
yields.
We utilize interest rate swaps to manage interest rate risk. The largest notional position of these swaps are receive fixed/pay
floating interest rate swaps that convert a portion of our commercial loan portfolio from floating rates, based on LIBOR, to
fixed rates. As of December 31, 2012, the outstanding notional balance of active swaps was $17.4 billion, which qualified as
cash flow hedges on variable rate commercial loans, compared to $14.9 billion as of December 31, 2011. In addition to the
income recognized from currently outstanding swaps, we also continue to recognize interest income over the original hedge
period resulting from terminated or de-designated swaps in a gain position that were previously designated as cash flow hedges
on variable rate commercial loans. Swap income declined to $508 million during 2012 from $625 million during 2011. The
$118 million decline was primarily due to a decline in the income from $3.5 billion of previously terminated swaps that
reached their original maturity date in April of 2012. As we manage our interest rate risk we may purchase and/or terminate
additional interest rate swaps. In the absence of additions or terminations, our notional balance of active swaps will begin to
mature in the second quarter of 2013 with remaining maturities through early 2017. The average maturity of our active swap
notional balances at December 31, 2012 was 2.4 years.
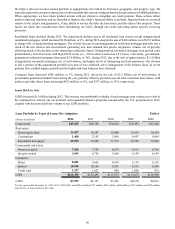
The commercial loan swaps have a fixed rate of interest that is received, while the rate paid is based on LIBOR. Estimated
quarterly income of these swaps based on current expectations of future LIBOR rates is as follows:
Ending
Notional Balances
of Active Swaps
(in billions)
Estimated Income
Related to Swaps
(in millions)
First Quarter 2013 $17.4 $113
Second Quarter 2013 15.3 100
Third Quarter 2013 15.3 93
Fourth Quarter 2013 15.3 92
As of and for the year ended December 31, 2014 10.6 332
Average interest-bearing liabilities decreased by $2.0 billion, or 2%, from 2011, predominantly as a result of a $2.9 billion,
or 15%, decrease in higher-cost consumer and commercial time deposits, a $1.7 billion, or 13%, reduction in long-term debt,
and a $0.8 billion, or 2%, decrease in money market accounts, partially offset by increases in other short-term borrowings
and lower cost client deposits. Total average consumer and commercial deposits increased by $3.6 billion, or 3%, during
2012, compared to the same period during 2011. This increase was predominantly driven by a $6.3 billion, or 20%, increase
in demand deposits, partially offset by the aforementioned decline in higher-cost time deposits, which was driven by the
maturity of a large population of higher cost CDs. As of December 31, 2012, we expect approximately $7.0 billion of CDs
to mature during 2013. The growth in lower cost deposits was the result of successful sales efforts and clients’ increased
preference for more liquid products. The increase in other short-term borrowings was a result of new FHLB borrowings
during 2012, which reflects a continuation of the recent trend toward a more normalized funding distribution. The driver of