SunTrust 2012 Annual Report Download - page 51
Download and view the complete annual report
Please find page 51 of the 2012 SunTrust annual report below. You can navigate through the pages in the report by either clicking on the pages listed below, or by using the keyword search tool below to find specific information within the annual report.-
 1
1 -
2
-
3
-
4
-
5
-
6
-
7
-
8
-
9
-
10
-
11
-
12
-
13
-
14
-
15
-
16
-
17
-
18
-
19
-
20
-
21
-
22
-
23
-
24
-
25
-
26
-
27
-
28
-
29
-
30
-
31
-
32
-
33
-
34
-
35
-
36
-
37
-
38
-
39
-
40
-
 41
41 -
 42
42 -
 43
43 -
 44
44 -
 45
45 -
 46
46 -
 47
47 -
 48
48 -
 49
49 -
 50
50 -
 51
51 -
 52
52 -
 53
53 -
 54
54 -
 55
55 -
 56
56 -
 57
57 -
 58
58 -
 59
59 -
 60
60 -
 61
61 -
62
-
63
-
64
-
65
-
66
-
67
-
68
-
69
-
70
-
71
-
72
-
73
-
74
-
75
-
76
-
77
-
78
-
79
-
80
-
81
-
82
-
83
-
84
-
85
-
86
-
87
-
88
-
89
-
90
-
91
-
92
-
93
-
94
-
95
-
96
-
97
-
98
-
99
-
100
-
101
-
102
-
103
-
104
-
105
-
106
-
107
-
108
-
109
-
110
-
111
-
112
-
113
-
114
-
115
-
116
-
117
-
118
-
119
-
120
-
121
-
122
-
123
-
124
-
125
-
126
-
127
-
128
-
129
-
130
-
131
-
132
-
133
-
134
-
135
-
136
-
137
-
138
-
139
-
140
-
141
-
142
-
143
-
144
-
145
-
146
-
147
-
148
-
149
-
150
-
151
-
152
-
153
-
154
-
155
-
156
-
157
-
158
-
159
-
160
-
161
-
162
-
163
-
164
-
165
-
166
-
167
-
168
-
169
-
170
-
171
-
172
-
173
-
174
-
175
-
176
-
177
-
178
-
179
-
180
-
181
-
182
-
183
-
184
-
185
-
186
-
187
-
188
-
189
-
190
-
191
-
192
-
193
-
194
-
195
-
196
-
197
-
198
-
199
-
200
-
201
-
202
-
203
-
204
-
205
-
206
-
207
-
208
-
209
-
210
-
211
-
212
-
213
-
214
-
215
-
216
-
217
-
218
-
219
-
220
-
221
-
222
-
223
-
224
-
225
-
226
-
227
-
228
 |
 |
35
We remain committed to providing financing and fulfilling the credit needs in the communities that we serve and are focused on
extending credit to qualified borrowers. To that end, during 2012, we extended approximately $90 billion in new loan originations,
commitments, and renewals of commercial, residential, and consumer loans to our clients, an increase of over 7% from 2011.
Deposits remained at record highs during 2012, and the shift in deposit mix seen during 2011 to lower-cost deposits continued.
Average consumer and commercial deposits increased 3% during the year ended December 31, 2012, compared to the same period
in 2011. The driver was an average balance increase of 20% in noninterest-bearing DDAs. Partially offsetting the noninterest-
bearing increase was a decline in higher cost time deposits of 15% due to maturities of CDs. This continued shift within deposit
products, together with a reduction in deposit rates paid, has helped to mitigate some of the industry-wide rate pressure on asset
yields. While a portion of the low-cost deposit growth is likely attributable to clients’ desires for having increased liquidity, we
continue to believe that we have also proactively generated this growth in both our Consumer and Wholesale businesses as we
expanded the number of primary client relationships during 2012. Due to the growth seen in core deposits, our liquidity has been
enhanced, enabling us to reduce our higher-cost wholesale funding sources, primarily long-term debt, which we reduced, on
average, by 13% compared to the year ended December 31, 2011. See additional discussions in the "Net Interest Margin" and
"Borrowings" sections of this MD&A.
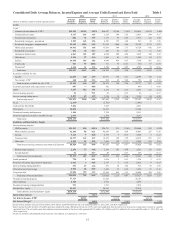
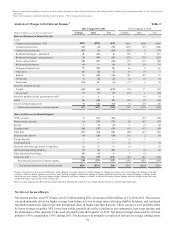
Total revenue, on an FTE basis, increased 23% during 2012, driven by securities gains realized on the sale of our Coke common
stock and, to a lesser extent, a modest increase in net interest income and a significant increase in mortgage-related income. Net
interest income, on an FTE basis, increased 1% compared to 2011, primarily as a result of higher loan balances, lower interest
bearing liability balances and funding costs, and an improved funding mix. Our net interest margin was 3.40% for the year ended
December 31, 2012, compared to 3.50% during 2011. The decline in margin was a result of lower yielding loans, a decline in
securities AFS yields, the elimination of the Coke dividend due to the sale and contribution of our Coke stock during 2012, and a
decline in our swap-related income related to maturing commercial loan swaps, partially offset by the redemption of $1.2 billion
of higher cost trust preferred securities, the maturity of higher cost CDs, and the continued favorable shift in deposit mix to lower
cost accounts. Noninterest income increased 57% compared to 2011, driven by the gains realized on the sale of our Coke common
stock. Additionally, an improvement in mortgage origination income was driven by the low interest rate environment and expanded
refinancing programs announced by the U.S. government, which resulted in a 39% increase in production volume during the year.
The increases in noninterest income were partially offset by an increase in the mortgage repurchase provision and, to a lesser
extent, declines in card fees and other income. The mortgage repurchase provision increased $211 million during 2012 compared
to 2011, as a result of information received during 2012 from the GSEs, as well as our recent experience related to demands, that
enhanced our ability to estimate losses of remaining expected demands on foreclosed and currently delinquent pre-2009 GSEs
loan sales. Card fees were lower in 2012 compared to 2011 due to the regulations on debit card interchange fees that became
effective in 2011. Other income was lower due to losses related to the transfer and sale of guaranteed student and mortgage loans
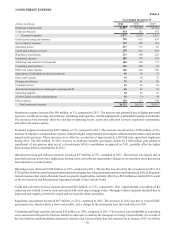
during 2012. Noninterest expense increased 1% during the year ended December 31, 2012 compared to the year ended December
31, 2011, primarily as a result of higher personnel costs and increased outside processing expenses. The increase in personnel costs
was due to higher incentive compensation due to improved business performance; and outside processing expenses increased
largely due to increased outsourced processing services. Operating losses and regulatory fees declined reflecting our improved
risk profile. See additional discussion of our financial performance in the “Consolidated Financial Results” section of this MD&A.
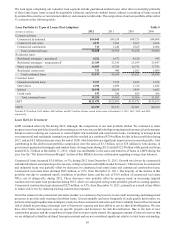
Line of Business Highlights
During 2012, we changed our reporting segments and now measure business activities based on three business segments: Consumer
Banking and Private Wealth Management, Wholesale Banking, and Mortgage Banking, with the remainder in Corporate Other.
During the year ended December 31, 2012, our core performance improved in each line of business compared to the year ended
December 31, 2011.
In Consumer Banking and Private Wealth Management, we had solid consumer loan production growth, with year-to-date volume
13% higher than in 2011. Favorable deposit trends also continued, as we generated average DDA growth of 20% during 2012.
From a revenue perspective, our consumer business continues to be challenged due to regulatory headwinds; however, we
experienced a moderate increase in net interest income. During 2012, we observed that clients were increasingly utilizing self-
service channels, which has enabled us to make changes to our staffing model to improve our efficiency and effectiveness, while
maintaining high service levels.
Wholesale Banking continued to deliver strong results, with net income more than double what it was in 2011. Significant growth
in capital markets fees, coupled with higher net interest income as a result of 7% increases in average loans and deposits drove
record revenue of $3.4 billion, 8% higher during 2012 compared to 2011. Also aiding net income growth was a decline of 4% in
noninterest expenses in 2012, which helped to drive our efficiency ratio below 60%.