SunTrust 2012 Annual Report Download - page 63
Download and view the complete annual report
Please find page 63 of the 2012 SunTrust annual report below. You can navigate through the pages in the report by either clicking on the pages listed below, or by using the keyword search tool below to find specific information within the annual report.-
 1
1 -
2
-
3
-
4
-
5
-
6
-
7
-
8
-
9
-
10
-
11
-
12
-
13
-
14
-
15
-
16
-
17
-
18
-
19
-
20
-
21
-
22
-
23
-
24
-
25
-
26
-
27
-
28
-
29
-
30
-
31
-
32
-
33
-
34
-
35
-
36
-
37
-
38
-
39
-
40
-
41
-
42
-
43
-
44
-
45
-
46
-
47
-
48
-
49
-
50
-
51
-
52
-
 53
53 -
 54
54 -
 55
55 -
 56
56 -
 57
57 -
 58
58 -
 59
59 -
 60
60 -
 61
61 -
 62
62 -
 63
63 -
 64
64 -
 65
65 -
 66
66 -
 67
67 -
 68
68 -
 69
69 -
 70
70 -
 71
71 -
 72
72 -
 73
73 -
74
-
75
-
76
-
77
-
78
-
79
-
80
-
81
-
82
-
83
-
84
-
85
-
86
-
87
-
88
-
89
-
90
-
91
-
92
-
93
-
94
-
95
-
96
-
97
-
98
-
99
-
100
-
101
-
102
-
103
-
104
-
105
-
106
-
107
-
108
-
109
-
110
-
111
-
112
-
113
-
114
-
115
-
116
-
117
-
118
-
119
-
120
-
121
-
122
-
123
-
124
-
125
-
126
-
127
-
128
-
129
-
130
-
131
-
132
-
133
-
134
-
135
-
136
-
137
-
138
-
139
-
140
-
141
-
142
-
143
-
144
-
145
-
146
-
147
-
148
-
149
-
150
-
151
-
152
-
153
-
154
-
155
-
156
-
157
-
158
-
159
-
160
-
161
-
162
-
163
-
164
-
165
-
166
-
167
-
168
-
169
-
170
-
171
-
172
-
173
-
174
-
175
-
176
-
177
-
178
-
179
-
180
-
181
-
182
-
183
-
184
-
185
-
186
-
187
-
188
-
189
-
190
-
191
-
192
-
193
-
194
-
195
-
196
-
197
-
198
-
199
-
200
-
201
-
202
-
203
-
204
-
205
-
206
-
207
-
208
-
209
-
210
-
211
-
212
-
213
-
214
-
215
-
216
-
217
-
218
-
219
-
220
-
221
-
222
-
223
-
224
-
225
-
226
-
227
-
228
 |
 |

47
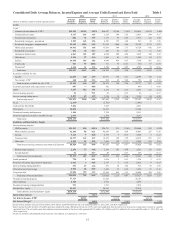
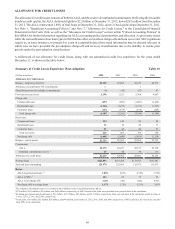
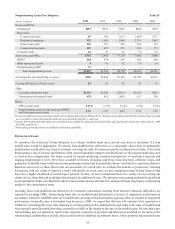
Selected Loan Maturity Data Table 7
As of December 31, 2012
Total 1 year or less 1-5 years After 5 years
(Dollars in millions)
Loan Maturity
Commercial and commercial real estate1$52,690 $20,057 $29,603 $3,030
Real estate - construction 713 145 497 71
Total $53,403 $20,202 $30,100 $3,101
Interest Rate Sensitivity
Selected loans with:
Predetermined interest rates $4,556 $1,841
Floating or adjustable interest rates 25,544 1,260
Total $30,100 $3,101
1Excludes $4.6 billion in lease financing and $838 million in installment loans.
We believe that our loan portfolio is well diversified by product, client, and geography throughout our footprint. However,
our loan portfolio may be exposed to certain concentrations of credit risk which exist in relation to individual borrowers or
groups of borrowers, certain types of collateral, certain types of industries, certain loan products, or certain regions of the
country. See Note 6, “Loans,” to the Consolidated Financial Statements in this Form 10-K for more information.
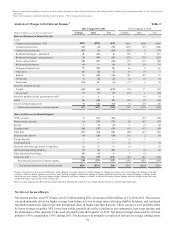
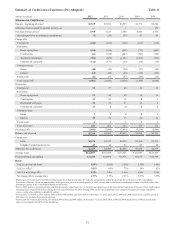
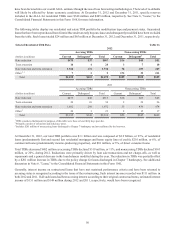
The following table shows our wholesale lending exposure at December 31 to selected industries:
Funded Exposures by Selected Industries Table 8
2012 2011
(Dollars in millions) Loans % of Total Loans % of Total
Consumer Products and Services $7,693 13% $7,105 13%
Diversified Financials and Insurance 7,155 12 5,591 10
Real Estate 6,331 11 7,331 13
Health Care and Pharmaceuticals 5,875 10 5,662 10
Government 3,964 7 3,671 7
Automotive 3,816 6 3,320 6
Retailing 3,626 6 3,593 6
Energy and Utilities 3,419 6 2,760 5
Diversified Commercial Services and Supplies 3,414 6 3,195 6
Capital Goods 3,411 6 2,974 5
Media and Telecommunication Services 2,466 4 2,052 4
Materials 1,960 3 1,823 3
Religious Organizations/Non-Profits 1,884 3 1,933 3
Transportation 1,737 3 1,231 2
Technology (Hardware and Software) 1,068 2 942 2
Individuals, Investments, and Trusts 902 2 986 2
Other Industries 167 — 1,703 3
Total $58,888 100% $55,872 100%