SunTrust 2012 Annual Report Download - page 169
Download and view the complete annual report
Please find page 169 of the 2012 SunTrust annual report below. You can navigate through the pages in the report by either clicking on the pages listed below, or by using the keyword search tool below to find specific information within the annual report.-
 1
1 -
2
-
3
-
4
-
5
-
6
-
7
-
8
-
9
-
10
-
11
-
12
-
13
-
14
-
15
-
16
-
17
-
18
-
19
-
20
-
21
-
22
-
23
-
24
-
25
-
26
-
27
-
28
-
29
-
30
-
31
-
32
-
33
-
34
-
35
-
36
-
37
-
38
-
39
-
40
-
41
-
42
-
43
-
44
-
45
-
46
-
47
-
48
-
49
-
50
-
51
-
52
-
53
-
54
-
55
-
56
-
57
-
58
-
59
-
60
-
61
-
62
-
63
-
64
-
65
-
66
-
67
-
68
-
69
-
70
-
71
-
72
-
73
-
74
-
75
-
76
-
77
-
78
-
79
-
80
-
81
-
82
-
83
-
84
-
85
-
86
-
87
-
88
-
89
-
90
-
91
-
92
-
93
-
94
-
95
-
96
-
97
-
98
-
99
-
100
-
101
-
102
-
103
-
104
-
105
-
106
-
107
-
108
-
109
-
110
-
111
-
112
-
113
-
114
-
115
-
116
-
117
-
118
-
119
-
120
-
121
-
122
-
123
-
124
-
125
-
126
-
127
-
128
-
129
-
130
-
131
-
132
-
133
-
134
-
135
-
136
-
137
-
138
-
139
-
140
-
141
-
142
-
143
-
144
-
145
-
146
-
147
-
148
-
149
-
150
-
151
-
152
-
153
-
154
-
155
-
156
-
157
-
158
-
 159
159 -
 160
160 -
 161
161 -
 162
162 -
 163
163 -
 164
164 -
 165
165 -
 166
166 -
 167
167 -
 168
168 -
 169
169 -
 170
170 -
 171
171 -
 172
172 -
 173
173 -
 174
174 -
 175
175 -
 176
176 -
 177
177 -
 178
178 -
 179
179 -
180
-
181
-
182
-
183
-
184
-
185
-
186
-
187
-
188
-
189
-
190
-
191
-
192
-
193
-
194
-
195
-
196
-
197
-
198
-
199
-
200
-
201
-
202
-
203
-
204
-
205
-
206
-
207
-
208
-
209
-
210
-
211
-
212
-
213
-
214
-
215
-
216
-
217
-
218
-
219
-
220
-
221
-
222
-
223
-
224
-
225
-
226
-
227
-
228
 |
 |

Notes to Consolidated Financial Statements (Continued)
153
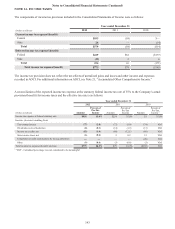
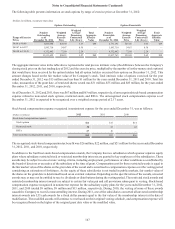
corporate bonds and U.S. Treasuries), and expenses. Capital market simulations from internal and external sources, survey data,
economic forecasts, and actuarial judgment are all used in this process.
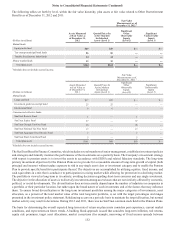
The expected long-term rate of return on plan assets for the SunTrust Retirement Plan and the NCF Retirement Plan was 7.00%
for 2012 and for 2011 was 7.75% through November 14 and 7.25% for the remainder of the year. The expected long-term rate of
return is 7.00% for all qualified plans for 2013. The asset allocation for the Pension Plans and the target allocation by asset category
are as follows:
Target
Allocation1Percentage of Plan Assets
as of December 312
Asset Category 2013 2012 2011
Equity securities 50-75 % 59% 61%
Debt securities 25-50 39 37
Cash equivalents 0-5 2 2
Total 100% 100%
1SunTrust Pension Plan only.
2SunTrust and NCF Pension Plans.
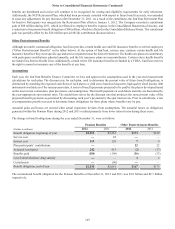
The investment strategy for the Other Postretirement Benefit Plans is maintained separately from the strategy for the Pension
Plans. The Company’s investment strategy is to create a series of investment returns sufficient to provide for current and future
liabilities at a reasonable level of risk and cash flow requirements. During 2012, the assets were diversified among index equity
funds and fixed income investments according to the asset mix approved by the SunTrust Benefits Finance Committee, which is
presented in the target allocation table below. With the Other Post Retirement Benefits having a shorter time horizon, a lower
equity profile is appropriate. The pre-tax expected long-term rate of return on retiree life plan assets was 6.25% for 2012 and 6.75%
for 2011. The after-tax expected long-term rate of return on retiree health plan assets was 4.06% for 2012 and 4.39% for 2011.
The 2013 after-tax expected long-term rate of return on retiree health plan assets is 3.25%. The 2013 pre-tax expected long-term
rate of return on retiree life plan assets is 5.00%. During 2012 and 2011, there was no SunTrust common stock held in the Other
Postretirement Benefit Plans.
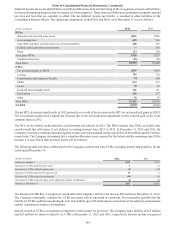
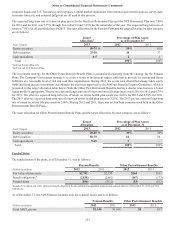
The asset allocation for Other Postretirement Benefit Plans and the target allocation, by asset category, are as follows:
Target
Allocation Percentage of Plan Assets
as of December 31
Asset Category 2013 2012 2011
Equity securities 20-40 % 30% 50%
Debt securities 50-70 61 50
Cash equivalents 5-15 9 —
Total 100% 100%
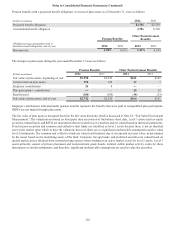
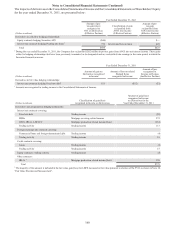
Funded Status
The funded status of the plans, as of December 31, was as follows:
Pension Benefits Other Postretirement Benefits
(Dollars in millions) 2012 2011 2012 2011
Fair value of plan assets $2,742 $2,550 $164 $161
Benefit obligations 1(2,838)(2,661)(167)(173)
Funded status ($96)($111)($3)($12)
1Includes $91 million and $107 million of benefit obligations for the unfunded nonqualified supplemental pension plans as of December 31, 2012 and 2011,
respectively.
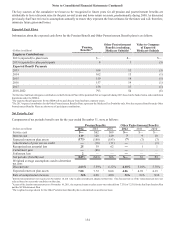
As of December 31, the AOCI balance includes only net actuarial losses and is as follows:
Pension Benefits Other Postretirement Benefits
(Dollars in millions) 2012 2011 2012 2011
Total AOCI, pre-tax $1,145 $1,108 $5 $17