SunTrust 2012 Annual Report Download - page 160
Download and view the complete annual report
Please find page 160 of the 2012 SunTrust annual report below. You can navigate through the pages in the report by either clicking on the pages listed below, or by using the keyword search tool below to find specific information within the annual report.-
 1
1 -
2
-
3
-
4
-
5
-
6
-
7
-
8
-
9
-
10
-
11
-
12
-
13
-
14
-
15
-
16
-
17
-
18
-
19
-
20
-
21
-
22
-
23
-
24
-
25
-
26
-
27
-
28
-
29
-
30
-
31
-
32
-
33
-
34
-
35
-
36
-
37
-
38
-
39
-
40
-
41
-
42
-
43
-
44
-
45
-
46
-
47
-
48
-
49
-
50
-
51
-
52
-
53
-
54
-
55
-
56
-
57
-
58
-
59
-
60
-
61
-
62
-
63
-
64
-
65
-
66
-
67
-
68
-
69
-
70
-
71
-
72
-
73
-
74
-
75
-
76
-
77
-
78
-
79
-
80
-
81
-
82
-
83
-
84
-
85
-
86
-
87
-
88
-
89
-
90
-
91
-
92
-
93
-
94
-
95
-
96
-
97
-
98
-
99
-
100
-
101
-
102
-
103
-
104
-
105
-
106
-
107
-
108
-
109
-
110
-
111
-
112
-
113
-
114
-
115
-
116
-
117
-
118
-
119
-
120
-
121
-
122
-
123
-
124
-
125
-
126
-
127
-
128
-
129
-
130
-
131
-
132
-
133
-
134
-
135
-
136
-
137
-
138
-
139
-
140
-
141
-
142
-
143
-
144
-
145
-
146
-
147
-
148
-
149
-
 150
150 -
 151
151 -
 152
152 -
 153
153 -
 154
154 -
 155
155 -
 156
156 -
 157
157 -
 158
158 -
 159
159 -
 160
160 -
 161
161 -
 162
162 -
 163
163 -
 164
164 -
 165
165 -
 166
166 -
 167
167 -
 168
168 -
 169
169 -
 170
170 -
171
-
172
-
173
-
174
-
175
-
176
-
177
-
178
-
179
-
180
-
181
-
182
-
183
-
184
-
185
-
186
-
187
-
188
-
189
-
190
-
191
-
192
-
193
-
194
-
195
-
196
-
197
-
198
-
199
-
200
-
201
-
202
-
203
-
204
-
205
-
206
-
207
-
208
-
209
-
210
-
211
-
212
-
213
-
214
-
215
-
216
-
217
-
218
-
219
-
220
-
221
-
222
-
223
-
224
-
225
-
226
-
227
-
228
 |
 |

Notes to Consolidated Financial Statements (Continued)
144
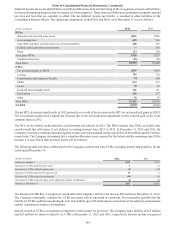
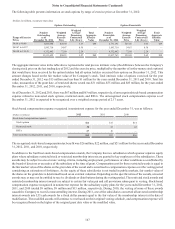
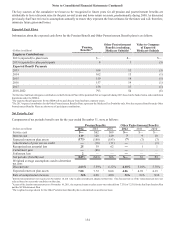
Deferred income tax assets and liabilities result from differences between the timing of the recognition of assets and liabilities
for financial reporting purposes and for income tax return purposes. These assets and liabilities are measured using the enacted
tax rates and laws that are currently in effect. The net deferred income tax liability is recorded in other liabilities in the
Consolidated Balance Sheets. The significant components of the DTAs and DTLs as of December 31 were as follows:
(Dollars in millions) 2012 2011
DTAs:
Allowance for loan and lease losses $861 $906
Accrued expenses 685 516
State NOL and other carryforwards (net of federal benefit) 209 197
Federal credits and other carryforwards —266
Other 173 168
Total gross DTAs 1,928 2,053
Valuation allowance (56) (65)
Total DTAs $1,872 $1,988
DTLs:
Net unrealized gains in AOCI $197 $995
Leasing 786 728
Compensation and employee benefits 74 100
MSRs 623 613
Loans 72 47
Goodwill and intangible assets 141 121
Fixed assets 196 177
Other 62 95
Total DTLs $2,151 $2,876
Net DTL ($279) ($888)
The net DTL decreased significantly in 2012 primarily as a result of the decrease in the DTL for net unrealized gains in AOCI.
The net unrealized gains had a significant decrease due to the reclassification adjustment for the realized gain on the Coke
common stock in 2012.
The DTA for the federal credit and other carryforwards was utilized in 2012. The DTAs include state NOLs and other state
carryforwards that will expire, if not utilized, in varying amounts from 2013 to 2032. At December 31, 2012 and 2011, the
Company recorded a valuation allowance against its state carryforwards and certain state DTAs of $56 million and $65 million,
respectively. The Company determined that a valuation allowance is not required for the federal and the remaining state DTAs
because it is more likely than not these assets will be realized.
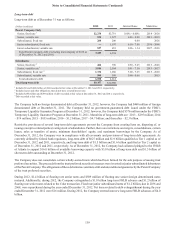
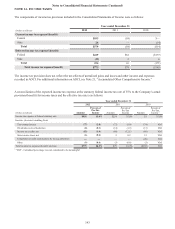
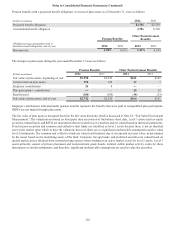
The following table provides a rollforward of the Company's federal and state UTBs, excluding interest and penalties, for the
years ended December 31:
(Dollars in millions) 2012 2011
Balance at January 1 $133 $132
Increases in UTBs related to prior years 112
Decreases in UTBs related to prior years (2) (12)
Increases in UTBs related to the current year 45 8
Decreases in UTBs related to settlements (34) (1)
Decreases in UTBs related to lapse of the applicable statutes of limitations (6) (6)
Balance at December 31 $137 $133
The amount of UTBs that, if recognized, would affect the Company's effective tax rate was $92 million at December 31, 2012.
The Company continually evaluates the UTBs associated with its uncertain tax positions. It is reasonably possible that the
liability for UTBs could decrease during the next 12 months by up to $65 million due to completion of tax authority examinations
and the expiration of statutes of limitations.
Interest related to UTBs is recorded as a component of the income tax provision. The Company had a liability of $18 million
and $21 million for interest related to its UTBs at December 31, 2012 and 2011, respectively. Interest income recognized