SunTrust 2012 Annual Report Download - page 175
Download and view the complete annual report
Please find page 175 of the 2012 SunTrust annual report below. You can navigate through the pages in the report by either clicking on the pages listed below, or by using the keyword search tool below to find specific information within the annual report.-
 1
1 -
2
-
3
-
4
-
5
-
6
-
7
-
8
-
9
-
10
-
11
-
12
-
13
-
14
-
15
-
16
-
17
-
18
-
19
-
20
-
21
-
22
-
23
-
24
-
25
-
26
-
27
-
28
-
29
-
30
-
31
-
32
-
33
-
34
-
35
-
36
-
37
-
38
-
39
-
40
-
41
-
42
-
43
-
44
-
45
-
46
-
47
-
48
-
49
-
50
-
51
-
52
-
53
-
54
-
55
-
56
-
57
-
58
-
59
-
60
-
61
-
62
-
63
-
64
-
65
-
66
-
67
-
68
-
69
-
70
-
71
-
72
-
73
-
74
-
75
-
76
-
77
-
78
-
79
-
80
-
81
-
82
-
83
-
84
-
85
-
86
-
87
-
88
-
89
-
90
-
91
-
92
-
93
-
94
-
95
-
96
-
97
-
98
-
99
-
100
-
101
-
102
-
103
-
104
-
105
-
106
-
107
-
108
-
109
-
110
-
111
-
112
-
113
-
114
-
115
-
116
-
117
-
118
-
119
-
120
-
121
-
122
-
123
-
124
-
125
-
126
-
127
-
128
-
129
-
130
-
131
-
132
-
133
-
134
-
135
-
136
-
137
-
138
-
139
-
140
-
141
-
142
-
143
-
144
-
145
-
146
-
147
-
148
-
149
-
150
-
151
-
152
-
153
-
154
-
155
-
156
-
157
-
158
-
159
-
160
-
161
-
162
-
163
-
164
-
 165
165 -
 166
166 -
 167
167 -
 168
168 -
 169
169 -
 170
170 -
 171
171 -
 172
172 -
 173
173 -
 174
174 -
 175
175 -
 176
176 -
 177
177 -
 178
178 -
 179
179 -
 180
180 -
 181
181 -
 182
182 -
 183
183 -
 184
184 -
 185
185 -
186
-
187
-
188
-
189
-
190
-
191
-
192
-
193
-
194
-
195
-
196
-
197
-
198
-
199
-
200
-
201
-
202
-
203
-
204
-
205
-
206
-
207
-
208
-
209
-
210
-
211
-
212
-
213
-
214
-
215
-
216
-
217
-
218
-
219
-
220
-
221
-
222
-
223
-
224
-
225
-
226
-
227
-
228
 |
 |

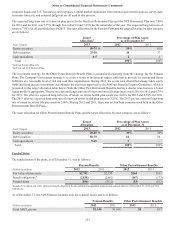
Notes to Consolidated Financial Statements (Continued)
159
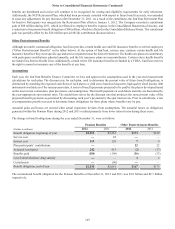
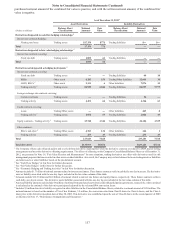
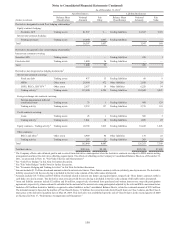
Impact of Derivatives on the Consolidated Statements of Income and Shareholders’ Equity
The impacts of derivatives on the Consolidated Statements of Income and the Consolidated Statements of Shareholders’ Equity
for the years ended December 31, 2012, 2011, and 2010, are presented below. The impacts are segregated between those
derivatives that are designated in hedging relationships and those that are used for economic hedging or trading purposes,
with further identification of the underlying risks in the derivatives and the hedged items, where appropriate. The tables do
not disclose the financial impact of the activities that these derivative instruments are intended to hedge.
Year Ended December 31, 2012
(Dollars in millions)
Amount of pre-
tax gain/(loss)
recognized in
OCI on Derivatives
(Effective Portion)
Classification of gain/(loss)
reclassified from
AOCI into Income
(Effective Portion)
Amount of pre-tax
gain/(loss)
reclassified from
AOCI into Income
(Effective Portion)
Derivatives in cash flow hedging relationships:
Equity contracts hedging Securities AFS1($171) Net securities gains ($365)
Interest rate contracts hedging Floating rate loans2252 Interest and fees on loans 337
Total $81 ($28)
1 During the year ended December 31, 2012, the Company also recognized $60 million of pre-tax gains directly into net securities gains related to mark-to-
market changes of the Coke hedging contracts when the cash flow hedging relationship failed to qualify for hedge accounting.
2 During the year ended December 31, 2012, the Company also reclassified $171 million, respectively, in pre-tax gains from AOCI into net interest income.
These gains related to hedging relationships that have been previously terminated or de-designated and are reclassified into earnings in the same period in
which the forecasted transaction occurs.
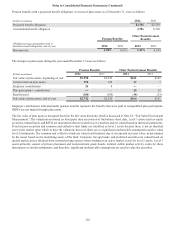
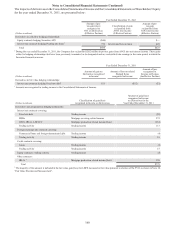
Year Ended December 31, 2012
(Dollars in millions)
Amount of gain
on Derivatives
recognized in Income
Amount of loss
on related Hedged Items
recognized in Income
Amount of gain/
(loss)
recognized in
Income on Hedges
(Ineffective
Portion)
Derivatives in fair value hedging relationships:1
Interest rate contracts hedging Fixed rate debt $5 ($5) $—
Interest rate contracts hedging Securities AFS 1 (1) —
Total $6 ($6) $—
1 Amounts are recognized in trading income in the Consolidated Statements of Income.
(Dollars in millions)
Classification of gain/(loss)
recognized in Income on Derivatives
Amount of gain/(loss)
recognized in Income
on Derivatives for the
Year Ended December 31, 2012
Derivatives not designated as hedging instruments:
Interest rate contracts covering:
Fixed rate debt Trading income ($2)
MSRs Mortgage servicing related income 284
LHFS, IRLCs Mortgage production related income/(loss) (331)
Trading activity Trading income 86
Foreign exchange rate contracts covering:
Commercial loans and foreign-denominated debt Trading income 129
Trading activity Trading income 14
Credit contracts covering:
Loans Other income 1(8)
Trading activity Trading income 24
Equity contracts - trading activity Trading income 8
Other contracts:
IRLCs 2Mortgage production related income/(loss) 930
Total $1,134
1 Includes $3 million of losses that were recognized in trading income for the first six months of 2012.
2 Substantially all of this amount is included in the fair value gain/(loss) for LHFS measured at fair value pursuant to election of the FVO, as shown in Note
18, "Fair Value Election and Measurement".