SunTrust 2012 Annual Report Download - page 79
Download and view the complete annual report
Please find page 79 of the 2012 SunTrust annual report below. You can navigate through the pages in the report by either clicking on the pages listed below, or by using the keyword search tool below to find specific information within the annual report.-
 1
1 -
2
-
3
-
4
-
5
-
6
-
7
-
8
-
9
-
10
-
11
-
12
-
13
-
14
-
15
-
16
-
17
-
18
-
19
-
20
-
21
-
22
-
23
-
24
-
25
-
26
-
27
-
28
-
29
-
30
-
31
-
32
-
33
-
34
-
35
-
36
-
37
-
38
-
39
-
40
-
41
-
42
-
43
-
44
-
45
-
46
-
47
-
48
-
49
-
50
-
51
-
52
-
53
-
54
-
55
-
56
-
57
-
58
-
59
-
60
-
61
-
62
-
63
-
64
-
65
-
66
-
67
-
68
-
 69
69 -
 70
70 -
 71
71 -
 72
72 -
 73
73 -
 74
74 -
 75
75 -
 76
76 -
 77
77 -
 78
78 -
 79
79 -
 80
80 -
 81
81 -
 82
82 -
 83
83 -
 84
84 -
 85
85 -
 86
86 -
 87
87 -
 88
88 -
 89
89 -
90
-
91
-
92
-
93
-
94
-
95
-
96
-
97
-
98
-
99
-
100
-
101
-
102
-
103
-
104
-
105
-
106
-
107
-
108
-
109
-
110
-
111
-
112
-
113
-
114
-
115
-
116
-
117
-
118
-
119
-
120
-
121
-
122
-
123
-
124
-
125
-
126
-
127
-
128
-
129
-
130
-
131
-
132
-
133
-
134
-
135
-
136
-
137
-
138
-
139
-
140
-
141
-
142
-
143
-
144
-
145
-
146
-
147
-
148
-
149
-
150
-
151
-
152
-
153
-
154
-
155
-
156
-
157
-
158
-
159
-
160
-
161
-
162
-
163
-
164
-
165
-
166
-
167
-
168
-
169
-
170
-
171
-
172
-
173
-
174
-
175
-
176
-
177
-
178
-
179
-
180
-
181
-
182
-
183
-
184
-
185
-
186
-
187
-
188
-
189
-
190
-
191
-
192
-
193
-
194
-
195
-
196
-
197
-
198
-
199
-
200
-
201
-
202
-
203
-
204
-
205
-
206
-
207
-
208
-
209
-
210
-
211
-
212
-
213
-
214
-
215
-
216
-
217
-
218
-
219
-
220
-
221
-
222
-
223
-
224
-
225
-
226
-
227
-
228
 |
 |
63
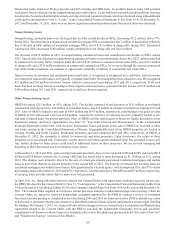
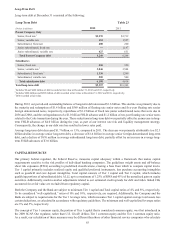
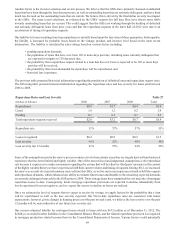
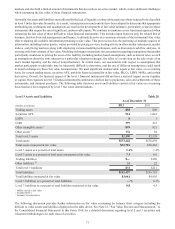
Long-Term Debt
Long-term debt at December 31 consisted of the following:
Long-Term Debt Table 23
(Dollars in millions) 2012 2011
Parent Company Only
Senior, fixed rate 1$2,270 $2,719
Senior, variable rate 152 1,527
Subordinated, fixed rate 200 200
Junior subordinated, fixed rate —1,197
Junior subordinated, variable rate 627 651
Total Parent Company debt 3,249 6,294
Subsidiaries
Senior, fixed rate 426 350
Senior, variable rate 23,846 2,504
Subordinated, fixed rate 31,336 1,260
Subordinated, variable rate 500 500
Total subsidiaries debt 6,108 4,614
Total long-term debt $9,357 $10,908
1 Includes $0 and $448 million of debt recorded at fair value at December 31, 2012 and 2011, respectively.
2 Includes $286 million and $289 million of debt recorded at fair value at December 31, 2012 and 2011, respectively.
3 Debt recorded at fair value.
During 2012, our period-end outstanding balance of long-term debt decreased $1.6 billion. This decline was primarily due to
the maturity and redemption of $1.4 billion and $589 million of floating rate senior notes and five-year floating rate senior
foreign denominated notes, respectively, repurchase of $1.2 billion of fixed rate junior subordinated notes that were due in
2036 and 2068, and the extinguishment of a $1.0 billion FHLB advance and $1.2 billion of ten-year floating rate senior notes
related to the Coke transaction during the year. These reductions in long-term debt were partially offset by an increase in long-
term FHLB advances of $4.0 billion during the year, as part of our interest rate risk and liquidity management strategy.
Consequently, the change in our debt mix has resulted in lower rates paid.
Average long-term debt decreased $1.7 billion, or 13%, compared to 2011. The decrease was primarily attributable to a $2.3
billion decline in average senior long-term debt, a decrease of $1.4 billion in average senior foreign-denominated long-term
debt, and a decline of $876 million in average subordinated long-term debt, partially offset by an increase in average long-
term FHLB advances of $3.0 billion.
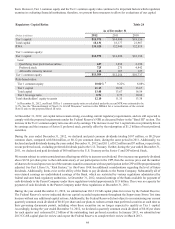
CAPITAL RESOURCES
Our primary federal regulator, the Federal Reserve, measures capital adequacy within a framework that makes capital
requirements sensitive to the risk profiles of individual banking companies. The guidelines weight assets and off-balance
sheet risk exposures (RWA) according to predefined classifications, creating a base from which to compare capital levels.
Tier 1 capital primarily includes realized equity and qualified preferred instruments, less purchase accounting intangibles
such as goodwill and core deposit intangibles. Total capital consists of Tier 1 capital and Tier 2 capital, which includes
qualifying portions of subordinated debt, ALLL up to a maximum of 1.25% of RWA and 45% of the unrealized gain on equity
securities. Additionally, mark-to-market adjustments related to our estimated credit spreads for debt and index linked CDs
accounted for at fair value are excluded from regulatory capital.
Both the Company and the Bank are subject to minimum Tier 1 capital and Total capital ratios of 4% and 8%, respectively.
To be considered “well-capitalized,” ratios of 6% and 10%, respectively, are required. Additionally, the Company and the
Bank are subject to requirements for the Tier 1 leverage ratio, which measures Tier 1 capital against average total assets less
certain deductions, as calculated in accordance with regulatory guidelines. The minimum and well-capitalized leverage ratios
are 3% and 5%, respectively.
The concept of Tier 1 common equity, the portion of Tier 1 capital that is considered common equity, was first introduced in
the 2009 SCAP. Our regulator, rather than U.S. GAAP, defines Tier 1 common equity and the Tier 1 common equity ratio.
As a result, our calculation of these measures may be different than those of other financial service companies who calculate